Airplane math that matters
Wing loading and power loading are overlooked measures that speak volumes

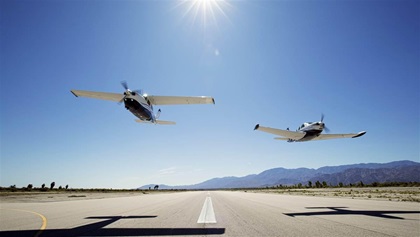 Cessna 210 versus Beechcraft Bonanza
An AOPA Fly-Off with a somewhat surprising result was the contest between a modified Cessna 210 Centurion and a Bonanza A36. The Centurion won both the high- and low-speed contests—a rarity for these events. The Centurion had received a major boost with the addition of a Continental IO-550 engine, and the increase in power allowed it to outperform a Bonanza with a nearly identical engine.
Wing loading is an airplane’s gross weight divided by its wing area, and it’s usually expressed in terms of pounds per square foot. (A 1,000-pound airplane with 100 square feet of wing area has a wing loading of 10 pounds per square foot.) High wing loading corresponds to higher maximum cruise speeds and greater stability in turbulent air, but also higher stall speeds and longer takeoff and landing distances.
Power loading is the airplane’s gross weight divided by horsepower. (A 1,000-pound airplane with a 100-horsepower engine has a power loading of 10 pounds per horsepower.) Airplanes with high power loading typically have lower fuel consumption and greater endurance, but also lower cruise speeds, longer takeoff rolls, and lower climb rates.
AOPA regularly pits similar general aviation airplanes against each other in an ongoing Fly-Off series—a Van’s RV–7 against a Mustang II kitbuilt airplane; a T–34 against a Nanchang CJ–6 military aircraft; a Stearman against a Waco biplane; a Cessna 210 against a Beechcraft Bonanza A36; a Beech Staggerwing against a Howard DGA–15; a Cessna 150 against a 152, a Cessna 182T Skylane against a Van’s RV–10, and a Cirrus SR22 against an RV–10. Myriad other factors play into aircraft performance categories, but wing loading and power loading are critical. In every matchup, the airplane with the higher wing loading was shown to have a faster top speed, and stall speed (both with flaps up and flaps down), than its rival. And the airplane with the lower power loading always had the better rate of climb.
You almost didn’t have to fly the airplanes side by side, as we did, to know how they would stack up. But pilots are a competitive, curious, “show me” bunch, so we did the aerial drag races just to see if reality matched the predictions on paper.
Before flying a Socata TB–30 Epsilon, for example, the French military trainer’s stubby wings obviously meant it would have high wing loading, and the actual number turns out to be 28 pounds per square foot—an exceptionally high figure for a single-engine piston trainer. Predictably, that high wing loading means the Epsilon has a relatively long ground roll and relatively high approach and stall speeds. On the positive side of the ledger, the Epsilon’s high wing loading gives it a fast cruise speed (188 knots) and an unbelievably high never exceed speed (282 knots).
One of the highest-performing piston warbirds of all time was the Grumman F8F Bearcat—and its wing loading and power loading figures show why U.S. Navy pilots regarded it as such a beast. Small wings put Bearcat wing loading at almost 40 pounds per square foot, and its power loading was an astonishing four pounds per horsepower. No wonder modified Bearcats set so many aircraft performance records, or that they later dominated the Unlimited air racing category.
Perhaps no aircraft designer pushed wing loading as far as Clarence Leonard “Kelly” Johnson, Lockheed’s legendary “skunk works” creator, who dreamed up the P–38 Lightning and U–2 and SR–71 spyplanes, among others. Johnson’s F–104 Starfighter had impossibly thin, short wings (196 square feet) that carried a mind-bending loading of 147 pounds per square foot.
The Starfighter set multiple speed and altitude records—but they also crashed a lot. Germany lost about 30 percent of its 900 Starfighters in operational accidents and darkly nicknamed them “witwenmacher,” or widow maker.
Dean Stickell, a former U.S. Air Force pilot who flew Starfighters in Europe, said the F–104’s fearsome reputation was largely undeserved. “It was an absolutely terrific airplane as long as you remembered its limitations,” he said. “As long as you didn’t turn below 300 knots or so, you’d be fine.”

Graph by Catherine Cavagnaro, originally published in The Perfect Aircraft (for the Mission)
Numbers don’t lie
By Dave Hirschman
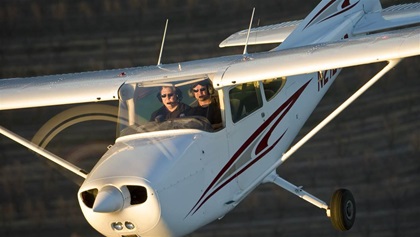 Cessna 172 Skyhawk
The Cessna 172 Skyhawk is a ubiquitous trainer, but its sturdiness comes with an aerodynamic price. The Skyhawk’s speed ratio, speed per horsepower, and miles per gallon all show a lack of aerodynamic efficiency.
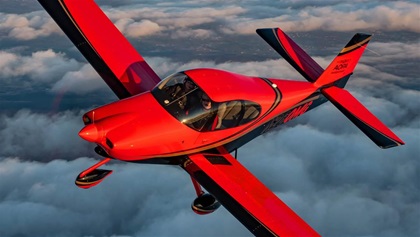 Van’s Aircraft RV–10
Lots of wing area and a big engine give this four-seat airplane a relatively low stall speed, an excellent rate of climb, and a high service ceiling of 20,000 feet—an impressive altitude for a nonturbocharged airplane.
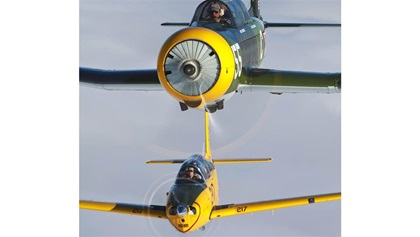 Beech T–34 versus Nanchang CJ–6
The Beech T–34 and Nanchang CJ–6 illustrate some of the priority differences between West and East. The Beech is sleeker, faster, more efficient, and more complex. The Nanchang from China is more rugged and more forgiving, with a lower stall speed.
The CAFE Foundation was begun more than 30 years ago to evaluate a broad array of aircraft technologies, and it came up with its own mathematical formula to judge aircraft efficiency.
(Speed times 2.25/Fuel Flow times Payload)
Look at the manufacturer specifications on any general aviation airplane and you’ll find a long list of numbers—but not the ones that matter most.
Here are some of the aircraft performance measures that reveal the most about an airplane’s capabilities.
An airplane’s “speed ratio” compares its maximum airspeed in level flight to its flaps-down stall speed (VSO). The wider the margin, the more versatile the airplane.
A Cessna 172S Skyhawk’s speed ratio is typical for trainers at about 2.6:1. A sleeker and more powerful, normally aspirated Cirrus SR22 improves to about 3:1. A retractable-gear Beechcraft Bonanza B36 is, somewhat surprisingly, a bit less at 2.9:1. And a Van’s Aircraft RV–10 (such as the AOPA 2020 Sweepstakes grand prize) has an unusually broad 4:1 speed ratio.
The RV–10’s extraordinarily wide speed ratio shows that it’s relatively fast, and it has very good low-speed performance. Most of the low-speed performance boils down to wing area and wing loading. Almost all the Van’s Aircraft kit airplanes have constant-chord “Hershey bar” wings (which simplify the construction process because all wing ribs are identical). That rectangular shape also gives the wings lots of area which, combined with light weight and high horsepower, stretches their speed ratio.
That broad speed range is a hallmark of Van’s Aircraft designs. They provide solid cross-country and short-field capability that serve as the basis for the company’s “total performance” design goals.
Speed per horsepower is another revealing but seldom discussed aircraft efficiency measure.
A 180-horsepower Cessna 172S cruising at 75-percent power (135 horsepower) is 124 knots—or 0.92 knots per horsepower. A normally aspirated 300-horsepower Cirrus SR22 at 75-percent power (225 horsepower) cruises about 180 knots—or 0.8 knots per horsepower. A 260-horsepower Van’s RV–10 at 75-percent power (195 horsepower) flies about 175 knots—or 0.9 knots per horsepower.
Slow airplanes that fly at the low end of the speed spectrum have an advantage in speed per horsepower because they pay a relatively light drag penalty. Doubling airspeed, for example, brings a fourfold increase in drag. That’s why a low-tech Luscombe Model 8F Silvaire built in the 1950s can deliver a top speed of 120 knots on just 90 horsepower—or 1.33 knots per horsepower.
Another useful and familiar performance measure from the automotive world is miles per gallon, yet few manufacturers use mpg because it’s seldom flattering to aircraft. A Cessna 172S Skyhawk, for example, gets about 15 statute miles per gallon in cruise. That’s better mileage than an H1 Hummer (12 mpg on the highway), but nothing to write home about.
Miles per gallon comparisons for aircraft improve in larger models when you consider seat miles per gallon. And those get downright impressive in modern airliners (a Boeing 777ER can get more than 73 seat miles per gallon at 500 miles per hour.) Miles per gallon is spectacular for a few ultra-efficient experimental category piston aircraft; race pilot Klaus Savier of Lightspeed Engineering gets up to 100 mpg in his Burt Rutan-designed canard aircraft.
The total cost per mile per hour is a calculation that aircraft owners do their best to avoid thinking about—especially when it comes to speed upgrades. In general, we’re drawn to airplanes that go fast, and we’re willing to pay for accessories that look good and add speed, especially when those two attributes go together.
An aircraft’s Carson Speed is the indicated airspeed that delivers the most speed for the least practical fuel consumption—yet it’s not marked on any airspeed indicator. The concept was spelled out in a 1980 scientific paper by aerodynamicist B.H. Carson, who called his theoretical number the “least wasteful way of wasting fuel.”
What pilots must know to determine the Carson Speed for any piston airplane is its best-glide speed, or VG. Add 32 percent to that, and that’s the Carson Speed. Flying at the Carson Speed is an aerodynamic bargain because it represents a 32-percent airspeed increase (over VG) yet fuel consumption rises just 16 percent.
For example, a normally aspirated Beechcraft Bonanza G36 (with the landing gear retracted) has a VG of 110 knots. Add 32 percent and the Carson Speed is 145 knots indicated airspeed (KIAS). Climb to the maximum altitude at which the Bonanza can maintain 145 KIAS in level flight (typically between 9,000 and 12,000 feet) and you’ll be flying as efficiently as possible in terms of speed and fuel consumption.
Flying faster than the Carson Speed imposes steep penalties in terms of fuel consumption and range. Flying at a slower indicated airspeed saves relatively small amounts of fuel in percentage terms.
Piston aircraft engines are measured in terms of horsepower and fuel consumption in gallons per hour. A piston aircraft engine’s specific fuel consumption, or the amount of fuel it consumes to produce a single horsepower, is surprisingly uniform. In general, an air-cooled aircraft engine uses about 0.06 gallons of avgas per horsepower when properly leaned in flight. A 100-horsepower aircraft engine, for example, typically burns about 6 gallons of avgas per hour at full power.
But engineers have found some clever ways to extract more power and greater efficiency. Heavier-than-standard pistons are one way to increase an engine’s power output. Heavier pistons provide greater force on the spinning crankshaft and propeller—an advantage to air racers looking for more speed, or long-distance fliers seeking greater flight efficiency. Bill Harrelson, an earthrounding endurance flier, equipped the Continental IO-550 engine in his Lancair IV with heavy pistons for his record-setting distance flights.
Electronic ignition systems also provide more power and greater fuel efficiency due to their variable timing. Unlike traditional magnetos which always fire at the same point in the engine’s operating cycle, variable timing accounts for changes in manifold pressure and air density at high altitude. Electronic ignition allows for an optimum air/fuel mixture in each cylinder, and more powerful spark plugs ensure that all the fuel in each combustion chamber is burned at the correct time for the most possible power.
Relatively new Austrian-designed Rotax engines have shown major improvements in the power to weight ratio of piston aircraft engines. A 100-horsepower Rotax 912 engine, for example, weighs about 140 pounds—or 50 pounds less than a Continental O-200D which produces the same horsepower. Both are four-cylinder engines. But Rotax uses far higher rpm (5,500 compared to 2,750), a propeller gear reduction drive, and both air and liquid cooling (rather than air alone) to produce the same amount of power from smaller cylinders.
Rotax engines dominate the light sport aircraft market, and the company has begun producing larger engines that could bring major changes to larger airplanes. The company’s turbocharged 915iS engine produces 141 horsepower and is making its way into a growing number of both experimental- and standard category aircraft.
Aircraft design has always been an imperfect art of balancing competing interests. Comfort or speed? Range or payload? Appearance or utility? Taking a close look at the hard numbers will show the designer’s priorities.