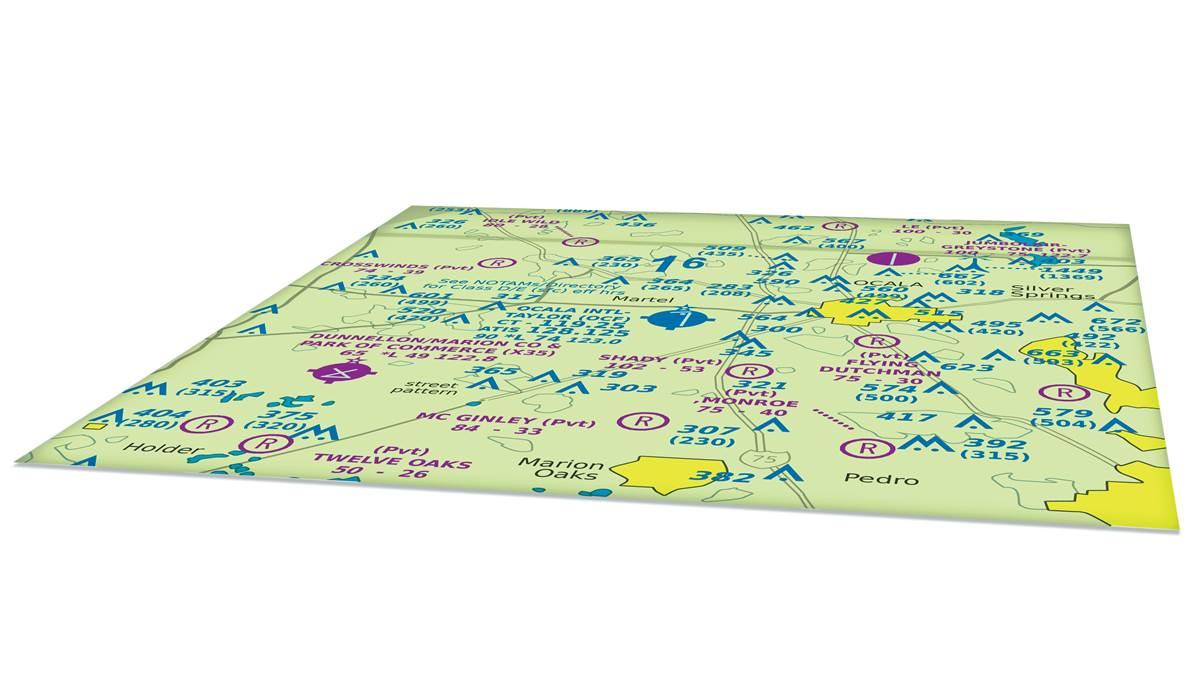
Aviation maps come in a variety of formats and styles. Visual flight rules pilots typically use one of three—the Sectional Aeronautical Chart, the World Aeronautical Chart, or the Terminal Area Chart. Sectionals are the most widely used because of their medium scale and large number of details. Terminal charts are available for Class B airspace, and are recommended there because they provide more detail than sectionals. World Aeronautical Charts (WACs) are double the scale of sectionals, which means they don’t provide nearly as much detail.
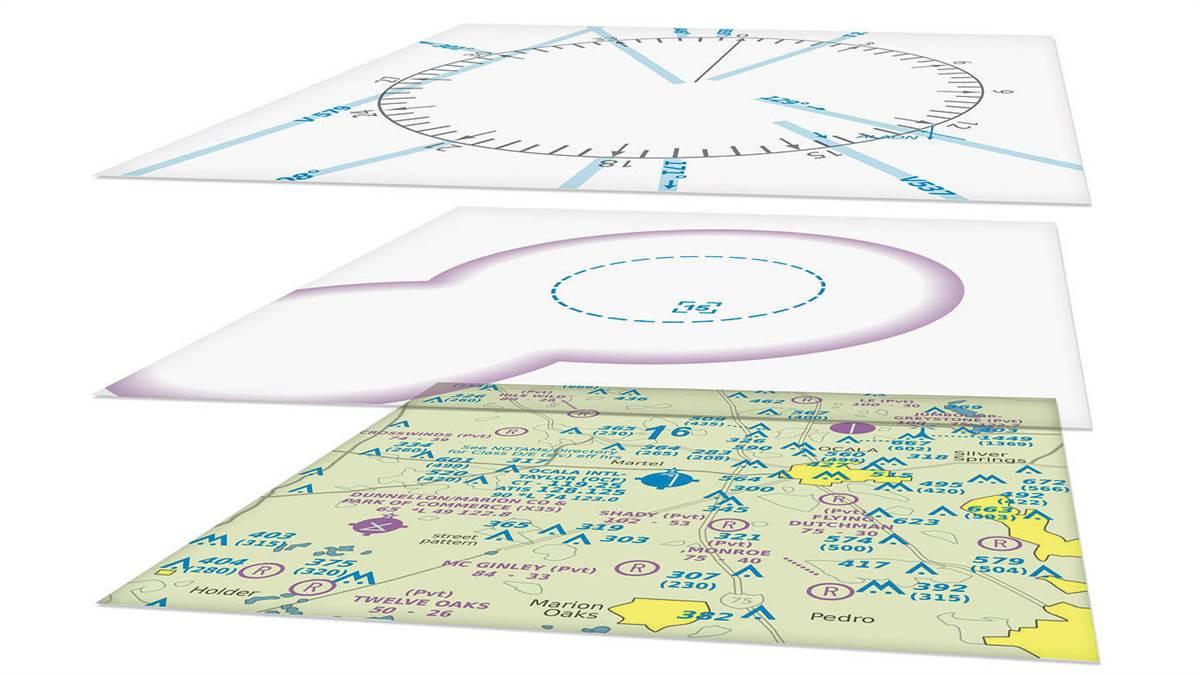
 Each of the VFR charts has three layers—
topographic information, airspace, and radio navigation information (see graphic to the right). That, combined with the huge amount of information they present, is what makes learning the sectional so challenging. In addition to resources such as AOPA Air Safety Institute courses and flash cards (www.aopa.org/asf), the FAA produces the Aeronautical Chart User’s Guide, a book that contains pretty much every symbol you’ll ever see on these charts. It’s a great resource you can find free online (http://aeronav.faa.gov).
Navigation
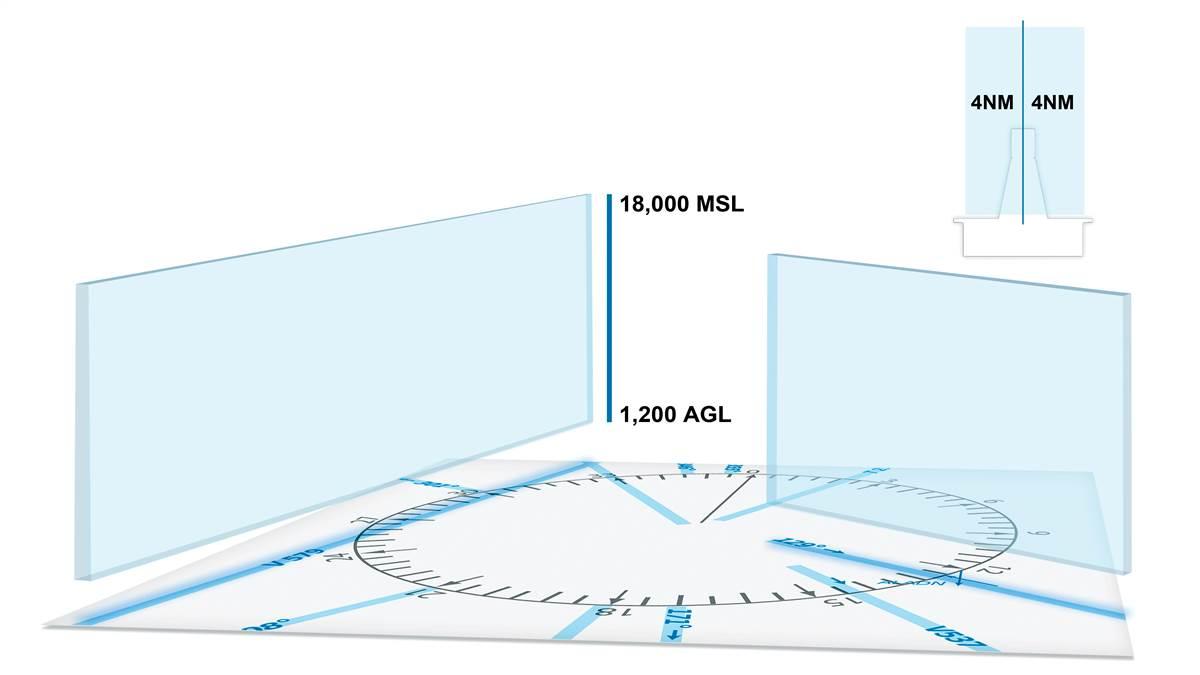
Welcome to your highway in the sky. The FAA has designated certain courses and denoted them on the chart. Typically these are used by pilots flying under instrument flight rules, but VFR pilots can use them as a reference. They are called Victor airways, and each extends from the center of a VOR like a hub-and-spoke system. The military also has airways called VR and IR routes. These are faint gray, and they’re shown on the chart strictly as a way of saying, “Watch out!” for the possibility of fast-moving military aircraft.
Airspace
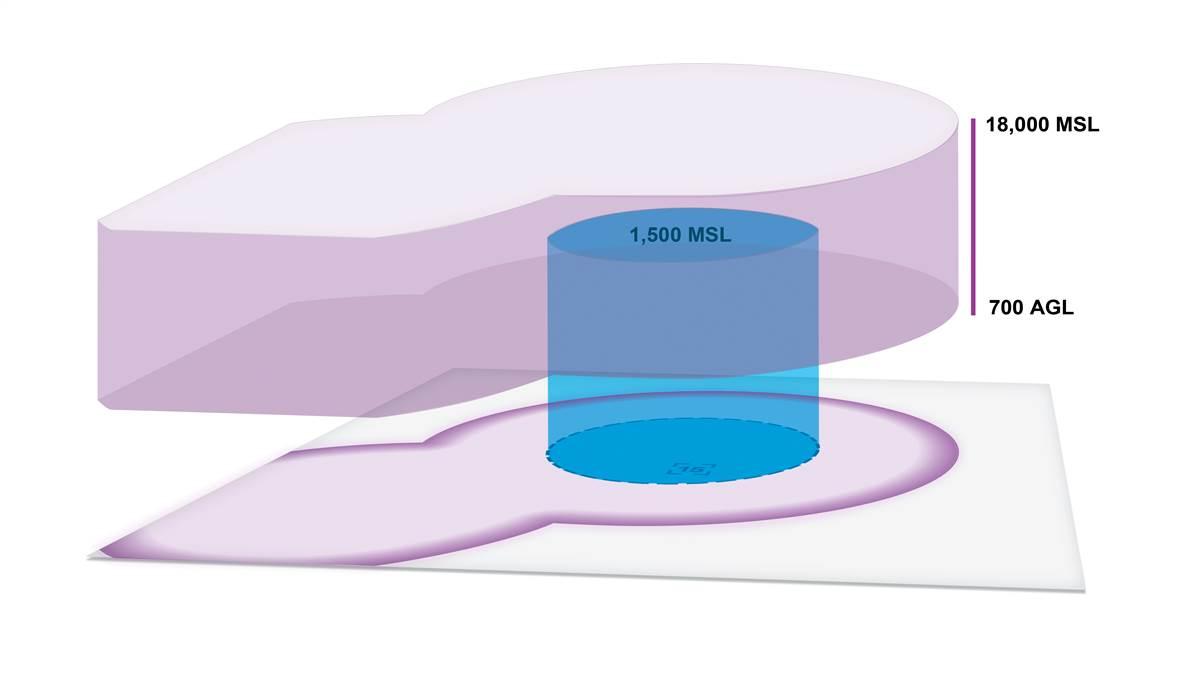
This is where things start to get tricky. Because we can’t actually see airspace, we have to imagine ourselves flying through it. That’s done on the chart through both lateral and vertical dimensions. Each type of airspace has a color or special boundary line to denote the lateral dimension, and a number (or series of numbers) to denote the vertical dimensions. The top number represents the ceiling of the area in hundreds of feet, and the lower number represents the floor, also in hundreds of feet. When only one number is present, such as Class D airspace, the figure represents the ceiling and the airspace extends to the ground.