Density Altitude
Beware of thin air
The triple-H effect
High altitude, high temperature, and high humidity create less dense or thinner air that contribute to high density altitude and impact aircraft and engine performance. If you’re flying in high terrain and into and out of airports at higher elevations pay close attention to the density altitude, especially between midmorning and midafternoon, as flight may be inadvisable. High density altitude—an inherent hazard in high terrain—can significantly degrade aircraft performance and surprise pilots during takeoff, climb, cruise, and landing. It’s therefore advisable to fly during the cool hours of the day.
Note: Please remember that high density altitude conditions result in longer takeoff and landing distances and shallow climb gradients.
Density altitude at your airport
Airport location, elevation, and temperatures that differ from international standard atmosphere (ISA) temperatures determine how density altitude will influence your aircraft’s performance at that airport.
The standard temperature at sea level is 15 degrees Celsius (59 degrees Fahrenheit) and the temperature gradient from sea level is minus 2 degrees Celsius (3.6 degrees Fahrenheit) per 1,000 feet. For example, at an elevation of 5,000 feet above sea level, an airport’s standard temperature would be 5 degrees Celsius (41 degrees Fahrenheit). But when that airport’s outside air temperature (OAT) is 30 degrees Celsius (85 degrees Fahrenheit), the density altitude will be 8,000 feet and your airplane will perform as if it is taking off and landing at an elevation of 8,000 feet. In a sense, it’s the altitude at which the airplane “feels” its flying.
The AOPA Air Safety Institute has developed a Density Altitude Poster to modify and use as a quick tool for knowing the density altitude values at your airport on a standard day. It’s a great reminder for you and other pilots of local conditions impacting density altitude and aircraft performance. Please request up to 10 printed 18x24" posters, large enough to prominently display at your airport, flying club, flight school, FBO, and backcountry strip. Once you submit the request form, we’ll mail the posters to you. In the meantime, please download a smaller 11x17" PDF version that has fillable text fields so it can also be easily modified for use at your airport. For both printed and downloaded posters, at the top of the poster, fill out your airport’s name, elevation, and standard temperature. Then calculate the density altitude for the various temperatures listed on the poster for a quick and easy reminder of how a few degrees can affect your aircraft’s performance.
Note: Altimeter settings below 29.92 will increase density altitude and decrease aircraft performance.
Example Posters

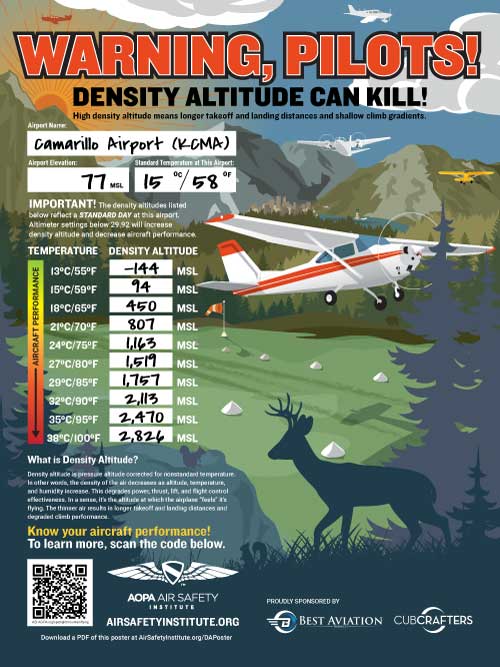
KCMA: Camarillo Airport in Camarillo, CA |
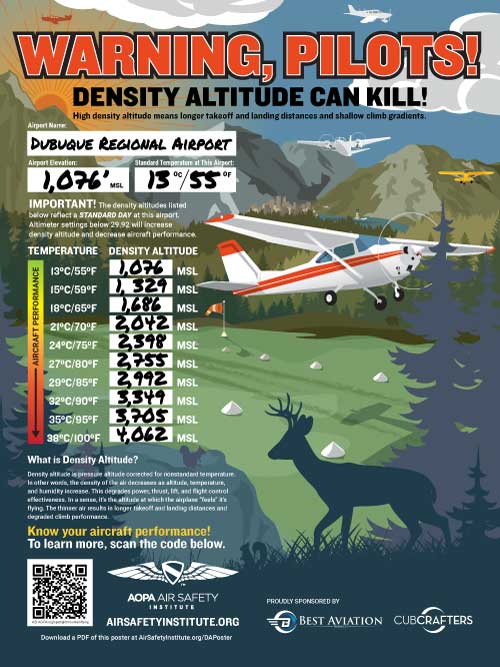
KDBQ: Dubuque Regional Airport, Dubuque, IA |
Calculations
High density altitude conditions require calculating what your aircraft’s actual performance will be during takeoff, cruise, and landing. There are various methods you can use.
For example, you should consult your aircraft’s pilot’s operating handbook (POH), but there are other tools that can help like an e6B, an electronic flight bag, or an online density altitude calculator such as NOAA’s. In addition, the FAA’s Pilot’s Handbook of Aeronautical Knowledge (PHAK) provides a Density Altitude graph to help you convert OAT and pressure altitude into density altitude.
Two other handy graphs are the FAA’s Rule-of-Thumb chart and the Koch Chart. The Koch Chart connects an airport’s pressure altitude with an airport’s temperature to calculate decreased rated of climb and increased takeoff distance percentages. You can find these in the FAA’s Density Altitude pamphlet.
Or, in a pinch, here’s a quick density altitude formula:
- Density altitude in feet = pressure altitude in feet + (120 x (OAT – ISA temperature)).
Note: Temperatures above standard and altimeter settings below 29.92 will increase density altitude and decrease aircraft performance.
Altitudes refresher
- Indicated—shown on the aircraft’s altimeter when set to current altimeter setting.
- True—aircraft’s height msl.
- Absolute—aircraft’s height agl.
- Pressure—indicated altitude with altimeter set to 29.92.
- Density—pressure altitude corrected for nonstandard temperature.
Learn more
Review the Mountain Flying Safety Spotlight to delve deeper into density altitude formulas and calculations and flying into and out of high elevation airports.
Visit the AOPA Air Safety Institute’s Backcountry Resource Center established since the 2021 AOPA Backcountry Outpost in Bozeman, Montana, that expanded opportunities for improving general aviation (GA) safety and outreach. The AOPA Air Safety Institute collaborated with backcountry organizations, type clubs, and a coalition of backcountry experts to identify and implement new safety initiatives, resources, and outreach across the region.
Density Altitude
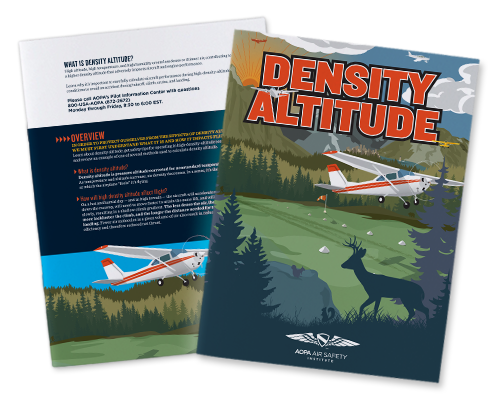
What is density altitude and why is it important?
Download our guide to find out!
Please review AOPA’s privacy policy to learn more about how your information is used.
Density Altitude
What is density altitude and why is it important?
Download our guide to find out!
Please review AOPA’s privacy policy to learn more about how your information is used.