Go/No Go?
Flight planning in the age of apps

The explosion of websites and cellphone applications over the past couple of decades has made go/no-go decisions both easier and more difficult than the days of weather-service reports available from a local FAA Flight Service outlet (see “The Way Things Used to Be”). We have lots of ways to get the data into our hands, literally. What we do with it is entirely up to us.
Doing it yourself
It is vital for self-briefing pilots to equip themselves with basic knowledge of weather theory, understanding the movement of highs and lows, frontal boundaries, and the impact of terrain and moisture sources. In today’s information-rich world, there’s no one to sort it out for us; we have to understand what’s currently occurring and what conditions will be like during the proposed flight.

The way things used to be
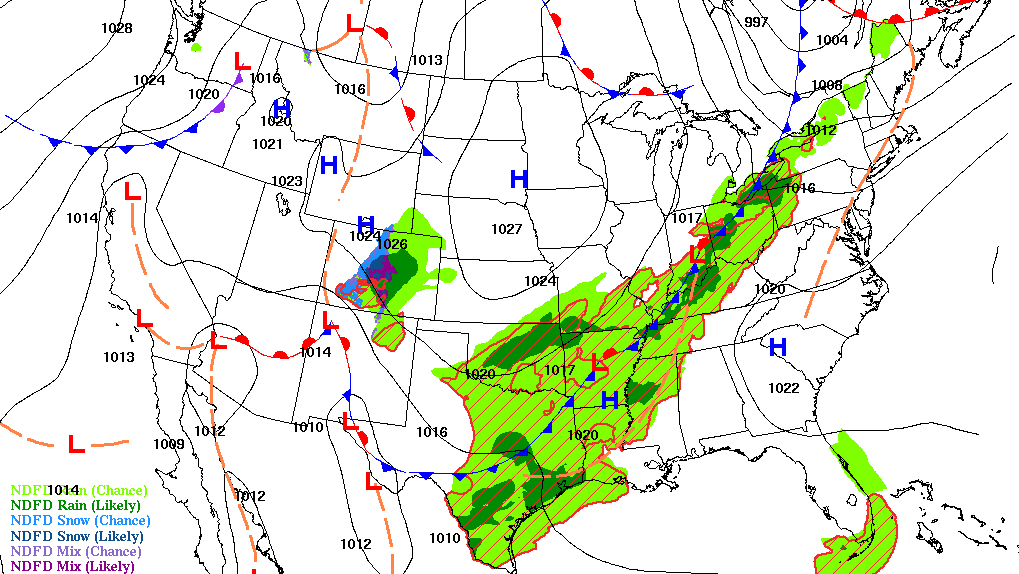
It’s best to begin with a big-picture view, such as the prognostic chart and satellite view covering the whole country, or at least the portion you’re going to fly in. Scanning a series of prog chart presentations tells you where the major weather features are located and where they might be in time-lapse intervals. The space-based view shows the recently seen impact of these events, in extent of cloud cover.
The direction and speed of winds on the ground and aloft are of great interest. An understanding of circulation around high- and low-pressure centers and the tightness or looseness of equal-pressure lines, or isobars, should be part of your self-briefing.
The modern wonder of weather radar presentations is especially helpful, when available as overlays on a route map and forecast charts. It’s important to understand the age of the data and to remember that radar doesn’t see clouds, or perhaps even light precipitation. It also can’t tell if the falling precip is reaching the ground or a planned flight level. Water is the main reflecting medium that defines the radar picture, but it is a primary ingredient of flying weather. Therefore, a check of the recent radar picture and how the precip is moving is critical.
Pilots are primarily concerned with cloud height and visibility, which determines how high and how easily they can fly. VFR flyers want to know they can operate sufficiently clear of clouds along their route, while instrument pilots will be more interested in temperature and convective activity en route, and the destination and alternate airport conditions at the time of arrival. In either case, what the weather is now, and the trend of its improvement or deterioration, must be determined.
Breaking the code
Reading the coded terminal weather shown by popular apps and flight-planning software takes familiarity and a bit of study. FIS-B, the ADS-B in-flight weather service, also receives these coded reports. Learning the sequence of weather-data groupings, and what the abbreviations mean, is necessary to avoid misunderstandings.
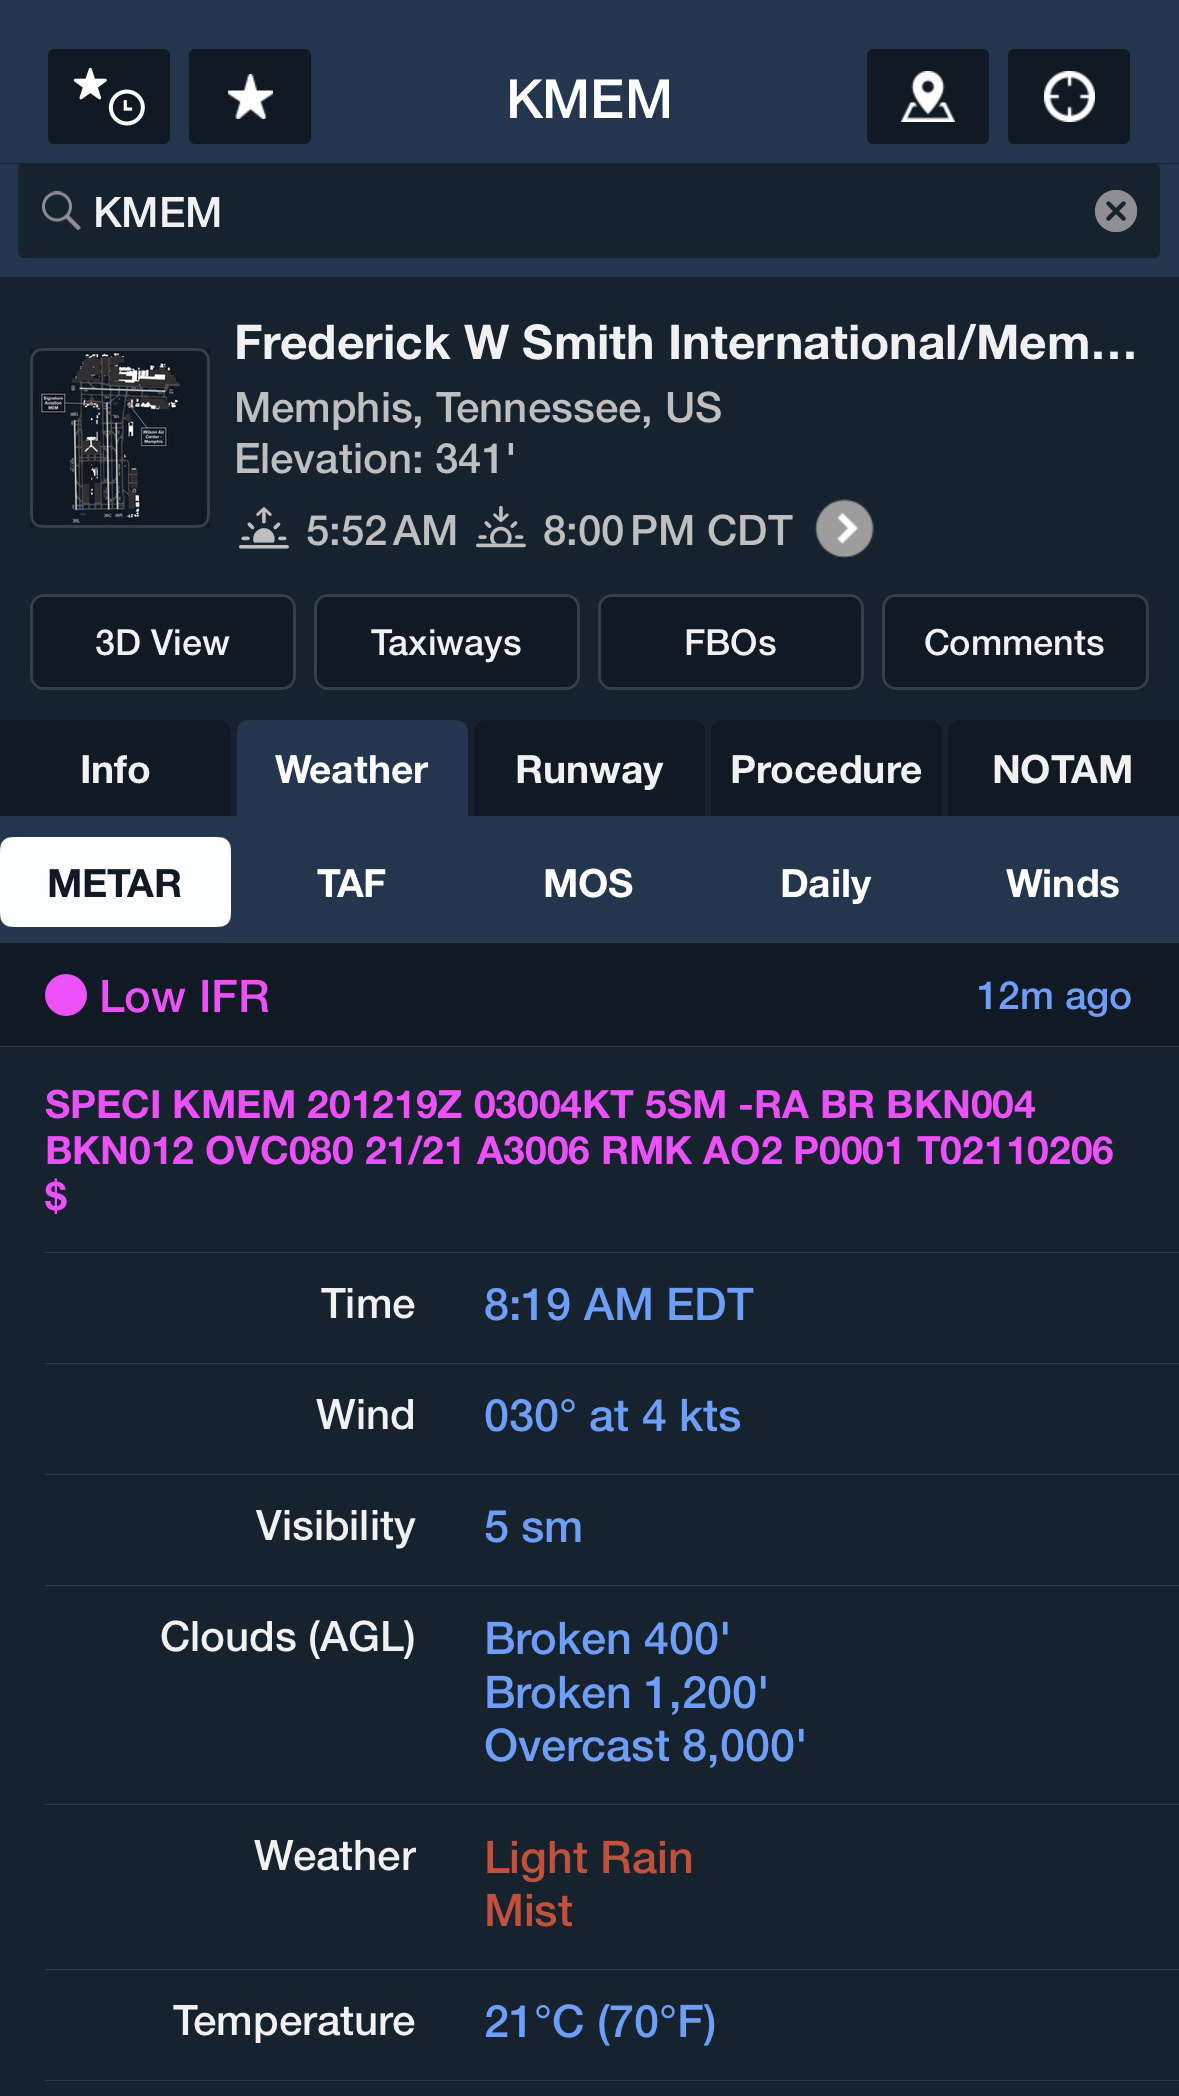
A METAR, or current local weather report, gives a reading of what was going on at the time of the observation, so it’s important to read the date-time group at the beginning, showing the day of the month and Zulu time of the report. If it’s an ATIS-based report, the time will probably end in “55” or similar hourly observation, so the data can be nearly an hour old by the time you see it. ASOS observations may be more timely, but are subject to sensor limitations, varying from minute to minute.
Surface wind direction and speed are next in the string, followed by visibility in statute miles, hence the “SM” suffix. Cloud height and coverage come next, often layered if conditions are scattered or broken. FEW is one- to two-eighths coverage, SCT can mean up to half the sky is cloud-covered. BKN ranges from five- to seven-eighths coverage, while OVC is a total obscuration. CLR doesn’t necessarily mean absence of clouds; sensor-based ceilometer reports ignore clouds above 12,000 feet above ground level (agl), or clouds not in the detecting range overhead. Remember that heights shown are the base of the clouds above the ground; you must add airport elevation to ascertain where you’ll run into them in flight.
Temperature and dew point are next, joined by a slash-mark, followed by the barometric pressure in inches and hundredths of mercury; the A stands for “altimeter setting.” The subsequent “RMK” section commonly precedes a note that you’re reading an automated observation, perhaps augmented by human input at larger airports, and any important remarks like lightning distant west, precipitation beginning and ending times, wind variability, and ceiling variances. The following SLP sea-level pressure grouping gives a shortened barometric reading in metric format; “159” would be 1015.9 hectopascals (millibars). Any subsequent T-codes are only useful for meteorologists.
The important thing to remember is that METARs are true only at the moment taken; it’s important to determine a trend over time, to see if conditions are stable or changing. And they are only good for the immediate vicinity of the airport; you should obtain several close-by reports to verify outlying weather.


What’s going to happen?
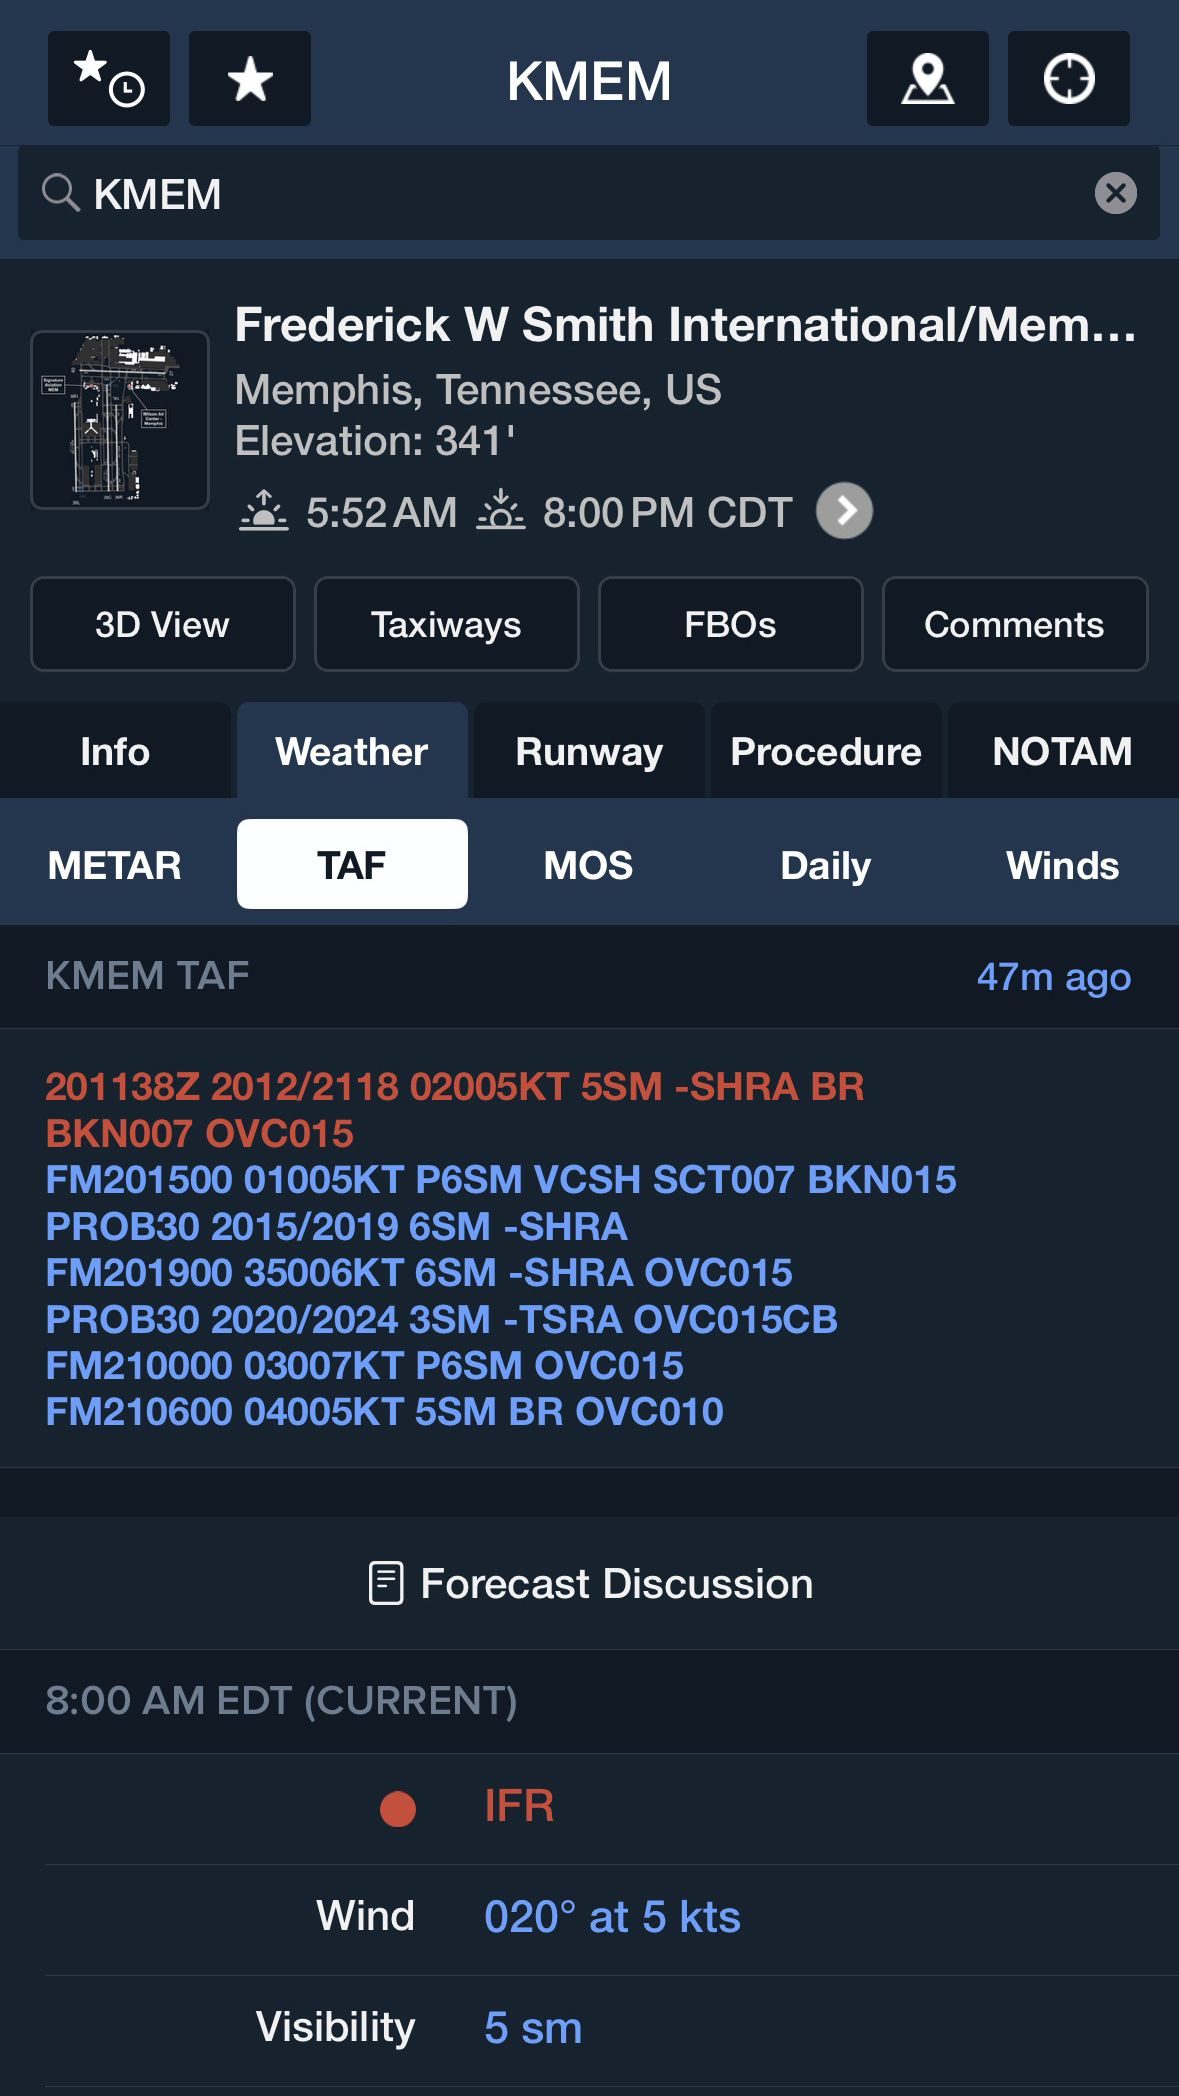
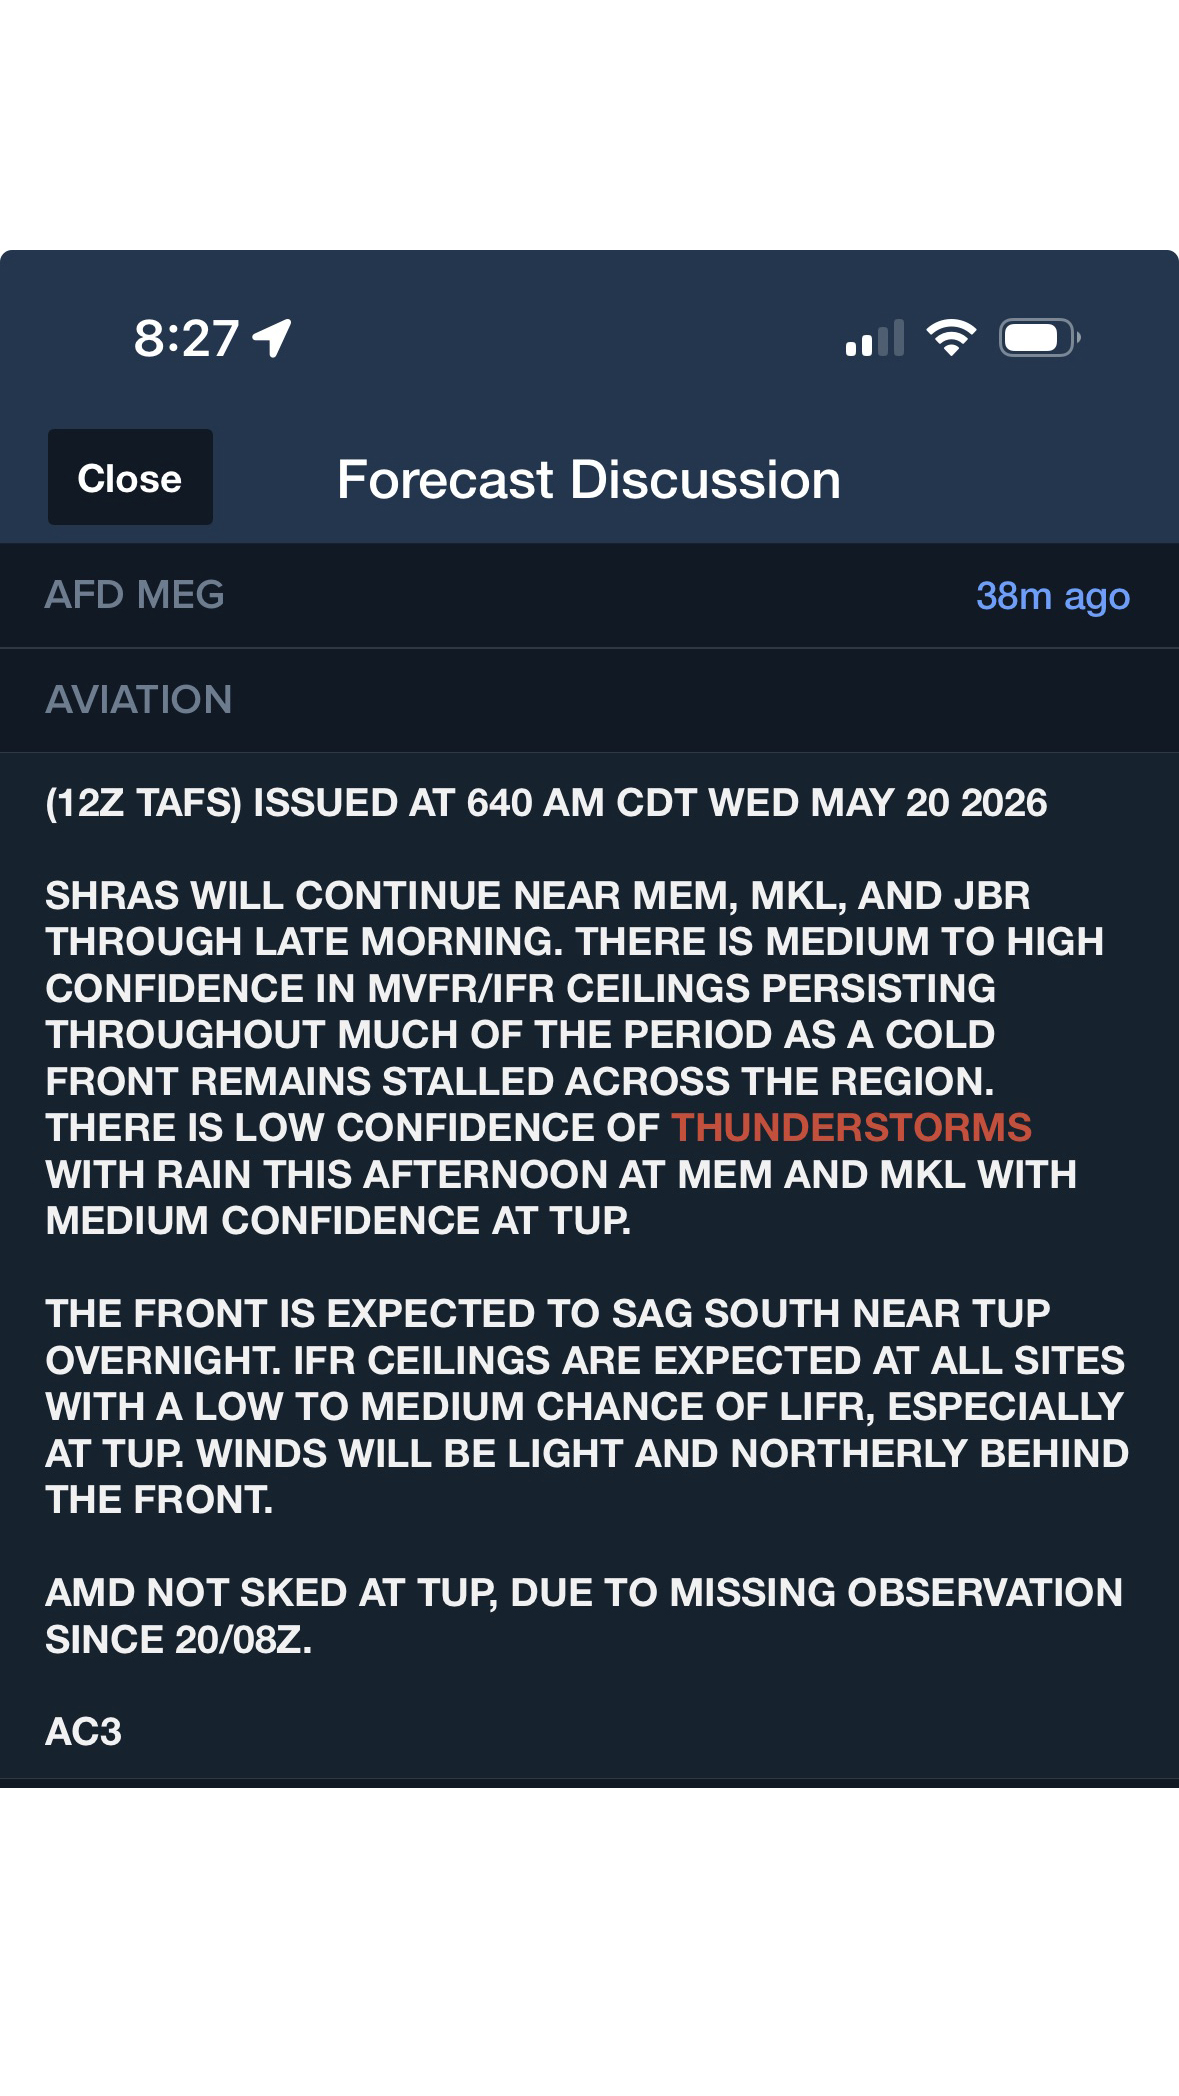
TAF means terminal aerodrome forecast, and as a prediction it always needs to be re-examined in full context of what’s actually occurring. Forecasters can only use indications seen in the overall weather system to predict what might occur at a given airport, and over time it may or may not happen. Trust, but verify.
When reading a TAF, the time of the forecast’s preparation leads off, followed by effective times and initial wind, visibility, and clouds. The lines following show expected changes in those three basic conditions at the times given, with probability percentages of occurrences like precipitation or wind shear. Continually update your preflight planning by checking en route, to see if the forecast is holding up.
TAFs are issued four times per day, at UTC midnight (0000), 0600, 1200 and 1800. Typically, only major airports have TAFs prepared for them, so most weather apps depicting expected weather for our local airport are based on analysis of NWS products at the closest airline field. Although amended forecasts are supposed to be issued when conditions no longer match those expected, in my experience it seldom happens. Compare and be aware.
Many pilots equate reported surface winds with what they’ll find at altitude, which can be a mistake from both direction and speed standpoints. The NWS goes to great length forecasting winds aloft at certain sites, releasing sounding balloons to send back temperature and, through measuring the balloon’s drift, winds encountered. Forecasts of the expected temps and winds are issued four times per day, valid for somewhat overlapping effective times. Altitudes forecasted are in 3,000-foot intervals starting at 3,000 feet msl (where applicable) up to 12,000 feet, then 6,000-foot intervals thereafter.
The four-digit group starts with the first two numbers being the true direction (not magnetic) and the last two are the expected speed, with special coding for winds above 99 knots. Temperature is prefixed with a plus or minus up to 24,000 feet, above which it’s assumed to be a minus value.
If your favorite app offers pilot reports (known as pireps), turn the feature on. A timely report of flight conditions is golden information, and it helps confirm (or disprove) what the METARs and TAFs are saying, when it comes to cloud bases, icing and turbulence. Offer up a report yourself, particularly if you encounter unexpected conditions. Take advantage of all the tools we now have at our fingertips, both pre-departure and in the cockpit. Don’t disregard the information if you can’t understand it; just take time to learn how to decipher what it’s saying.
LeRoy Cook has been flying and teaching since the early 1960s and is based in western Missouri. He is an airline transport pilot, CFI, and the author of 1,900 magazine articles and four aviation books.
Related Articles


