Charts are still charts
The value of the sectional
A lot of today’s pilots don’t consider maps to be all that important—but they are. Keeping a fresh chart in the airplane is still an important safety item, whether it is in electronic form stored in your iPad or tablet, or on paper in your backpack. Sectional charts present ground-based data in a form that matches the view out the window, and they show airspace and facility symbology available nowhere else.
Services such as ForeFlight and Garmin Pilot do an excellent job of mimicking the official visual flight rules (VFR) chart, adding many more features available at a touch. But we need to understand the basic chart’s details to take advantage of these features, no matter how the map is depicted.
In its pure paper form, the sectional’s 1:500,000 scale allows a generous view of the Earth’s surface, with a portrayal of roughly a mile per one-eighth of an inch, perfectly suited to airplanes cruising at speeds of 100 to 200 knots. Simply lay your thumb down on the chart and know that the space covered is about 8 statute miles. Electronic versions permit adjustment of the scale at a touch, for easier reading of the details, but if one has to revert to its paper equivalent the 8-statute-miles-per-one-inch size is an excellent rendition of the Earth’s surface.
The vertical ticked lines on the sectional represent degrees and minutes of latitude; each space between the tick marks is equivalent to one nautical mile, a handy scale for determining mileage. The horizontal ticked lines, on the other hand, are longitude (east-west) markers, and minutes of longitude are shorter than a mile except at the Equator, because the longitude lines draw closer together as they near the poles.
At the center of every latitude-longitude grid is a bold two-digit number, giving a bare-minimum altitude that will clear all known obstructions within the grid. The larger number is thousands of feet, the smaller one is hundreds. The altitude shown is at least 100 feet above the obstructions in that area. Bear in mind that your altimeter may be out of calibration by that scant amount, so you shouldn’t rely on that number as sufficient clearance, just a rock-bottom limit.
Why paper?
Paper charts have the advantage of allowing us to scan them in random fashion, particularly when looking for the features in the margins, such as military operations area (MOA) information or other tabulations. And there’s no worry about a battery running down or shutting off from overheating. Paper is always there.
If you have electronic charts on board, is it legally necessary to have a current paper chart for your route? The preflight action regulation, FAR 91.103, simply says the pilot must have “become familiar with all available information concerning that flight.” As far as the FAA is concerned, navigation information in electronic format is acceptable—until it fails and the information is no longer available. A backup source of flight data is a worthy consideration, be it a second electronic flight bag (EFB), a hard-copy chart, or even a contemporary flight log scribbled on a notepad.
Sectionals show airspace and facility symbology available nowhere else. What's the value of an information source if it can't be trusted?Sectional charts are issued on a 56-day cycle; their effective dates are printed right there on the front panel. Pilots can find additional information in the chart supplement for the region in which they are flying, formerly known as the airport/facility directory. The “green book” remains a comprehensive source of airport information and, as such, is the only official FAA source of operating data, whether it’s in the bound book or in your iPad.
Because we and the FAA have such unflagging faith in our electronic charts, it is no longer common to find a pile of in-date paper maps in the seat-back pocket. Most of us are content to have an older edition serving as a backup to the electronic equivalent. At $10 a pop, stingy pilots tend to ignore the acquisition of new charts, just as they often put off updating their GPS databases. Be realistic about your parsimony; what’s the value of an information source if it can’t be trusted?
Check for changes
Sometimes the most important changes on a new chart are what’s no longer there. The FAA is currently eliminating very high frequency omnidirectional radio range navaid (VOR) stations like discarded VHS tapes at a garage sale. After downloading updates to your EFB or buying a fresh paper chart, look it over for missing facilities you used to tune in for old-fashioned navigation. The station’s associated Victor airways may or may not still be there, depending on the structure being left in place to back up GPS. In some cases, the VOR compass rose is gone but a square DME symbol remains, because it’s needed for an instrument approach procedure.
You will find star-shaped symbols for GPS waypoints scattered around new charts, some with pennant flags that designate them as reporting points or ATC landmarks. If prefixed by the letters “VP” the GPS waypoint is for VFR use, not part of an instrument route or procedure.
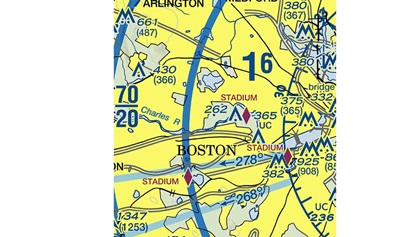
Some interesting symbols have been added for other reasons. A red diamond shape now indicates a stadium or other seating area capable of holding 30,000 people or more. This warns pilots that a temporary flight restriction will be effective around the location when an event is taking place, requiring that we avoid it by three miles and 3,000 feet agl from one hour before to one hour after the scheduled event.
Airspaces
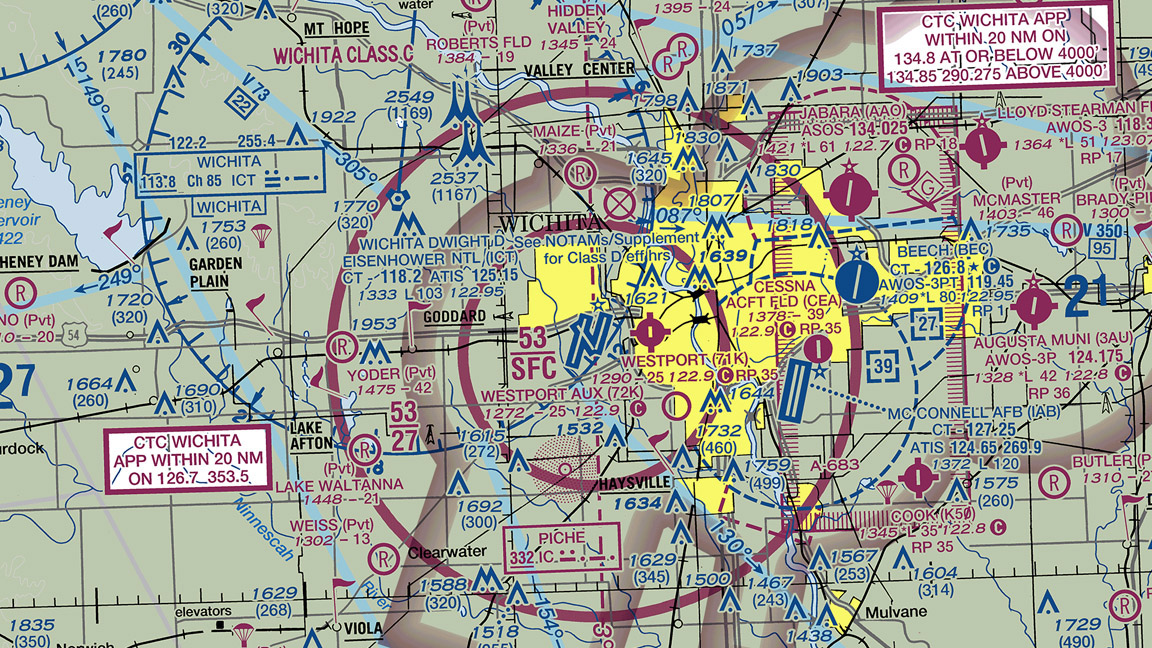
 Airspace depictions are an important feature of the sectional chart; you can decipher them by referring to the legend panel. Class A airspace is not shown, as it exists at 18,000 feet msl and above, and sectionals are intended for use below 18,000. Class B airspace surrounds major airports, shown as blue circular patterns with mean sea level altitudes for each of the concentric segments, accompanied by a 30-mile buffer zone requiring Mode C transponder use. Class C airspace is depicted by two smaller magenta rings around less-busy airports; approach control frequencies are printed on the sectional at Class C locations, while the frequencies for Class B airspace have to be looked up in the marginal listing or airport page on an EFB.
At Class C locations, pennant flags with a black place name or VP-prefixed designation designate commonly used reporting points for giving your location to ATC. They are not depicted on the sectional at Class B locations because pilots might be expected to use the larger-scale terminal area charts at these sites, which do show the reporting points.
Class D airspace, associated with an airport with a control tower, is shown by a blue airport symbol and a blue dashed circle surrounding the airport, along with a “CT” frequency for the control tower. Nontowered airports will be shown in magenta and will have a magenta dashed circle if Class E airspace extends down to the surface. Airports surrounded by magenta shading indicate Class E exists above 700 feet agl. Beyond the magenta shading, you can assume that Class E airspace is present above 1,200 feet agl.
Class E airspace merely requires increased weather standards for VFR operation, compared to Class G airspace; it does not imply being in contact with air traffic control or seeking permission to enter. The sectional chart legend shows a Class E boundary with a blue shading on the side containing Class E airspace from 1,200 feet upward. In most cases, this shading will not be found, because the entire sectional coverage incorporates Class E above 1,200 feet. Class G, by default, will be found below 1,200 feet except in the 700-foot agl magenta zones and in Class D or Class E down-to-the-surface airspaces.
Other airspace depictions include prohibited and restricted airspace, shown by a P or R prefixing a number. For effective altitudes and times, refer to the marginal tabulation on a side panel of the sectional chart. Special flight rules airspace, like the zone surrounding our country’s leadership in Washington, D.C., are shown by a blue margin around the protected area.
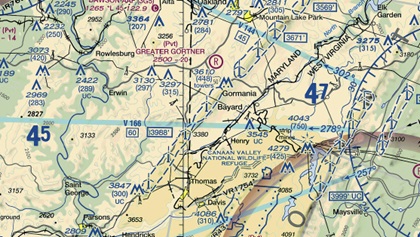
Military airspace depiction is mostly found in the form of a MOA, with magenta shading and a name and number, and military training routes, which are gray lines with a “V” or “I” letter and number. Alert areas are also designated by an “A” prefix and number, showing areas where intensive training activity is taking place. Specific information on the MOAs and alert areas will be found in the chart’s margin, while the MTR’s generic status is simply implied. Bear in mind that crossing through the designated military airspaces is not illegal, but you need to exercise caution because fast-moving mission-oriented aircraft can be using it.
Wildlife refuges are shown on the sectional, surrounded by a blue line with a row of dots inside the boundary. Pilots are requested (not required) to maintain 2,000 feet agl or more above the area and cannot land or drop items inside it.
Areas of electricity-generating wind turbines are outlined by blue dashes and show a maximum altitude of the generator blades, which can extend to 400 feet or more above the ground.
Airports
 Airport symbols on the sectional carry considerable information in their details. Nontowered airports are magenta in color, with a runway orientation shown if it’s paved and more than 1,500 feet in length. Four protruding squares on the circle indicate some services can be expected (fuel and tiedowns). An open circle indicates an unpaved runway, and an unnamed circle with an “X” on it is an abandoned airport with value as a visual landmark. Blue tower-controlled airports are assumed to have services available; check the chart supplement.
The accompanying information with the airport gives its elevation, runway length, lighting status, and the weather and communications frequencies. A star above the airport symbol indicates a light beacon is present to help locate it after dark; an asterisk beside the “L” in the data block means the runway lights may not be continuously operating at night. Refer to the chart supplement to see what action to take to get them turned on.
Watch for “RP” notations below the nontowered airport’s data block, indicating that a nonstandard right-hand traffic pattern is required on the runways shown after the RP. In the absence of such a note, you should fly a left pattern.
Privately owned airports are shown by “PVT” next to the data block and an “R” on the airport symbol, restricting it to prior-permission use. Not all private airports are shown on the chart, by owner option.
Whether using an old-fashioned printed sectional chart or an electronic equivalent, pay attention to the latest changes and the myriad details available. Sectionals remain a valuable resource.


