Weather: Second opinions
Meeting MOS and meteograms

GFS and NAM MOS forecasts are available on the National Weather Service website for many stations, many of which are at general aviation airports not served by TAFs. (MOS forecasts also are available on the ForeFlight app, in easy-to-read text presented in an hourly format.) Remember, TAFs are valid for an area within a 5-statute-mile radius of the airport. MOS forecasts can be valuable advisories, but TAFs are the official sources for airport forecasts. That’s because they are created by meteorologists at the National Weather Services’ weather forecast offices who are familiar with local weather patterns. But, guess what they check when making their forecasts—yep, MOS data.
Don’t want to decode a bunch of text codes? Then meteograms can provide visual charts of weather conditions at airports and other, user-defined (by latitude and longitude) locations around the nation. Meteograms also use MOS data as source material but are not as detailed as MOS-generated forecasts, vary in design, and can extend to eight days in the future. Like MOS information, meteograms are not valid as official preflight weather sources, but they can offer plenty of high-quality situational awareness. Search around and you’ll find more websites offering meteograms of various designs, including the Rapid Update Cycle model’s output, which lets you access up to 600 airports. By comparing MOS text and meteogram forecasts you can see how the GFS, NAM, RUC, and other sources can come up with different ideas of future weather. Comparing them against TAFs can shed insights on how aviation meteorologists buy into them—or not.
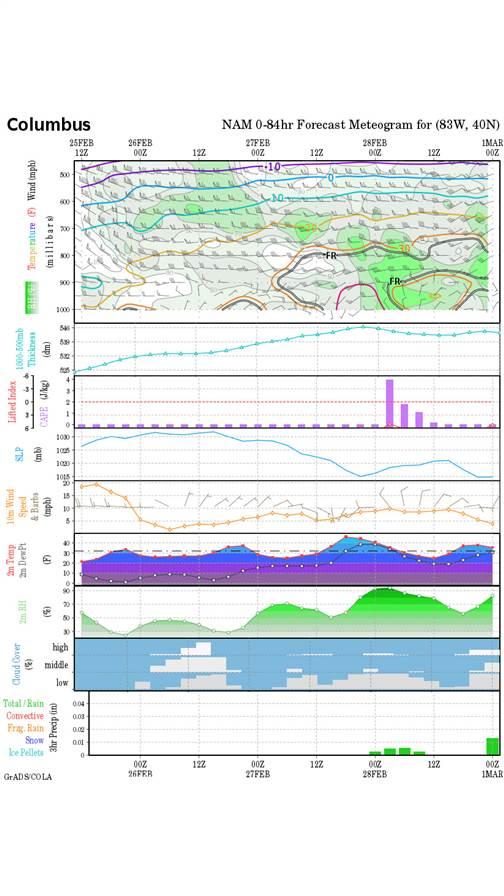
- The top panel shows wind barbs for altitudes forecast for pressure levels from the surface (1,000 mb) through 5,000 feet (800 mb) to 18,000 feet (500 mb). Multiple freezing levels (FR contours) rise to 6,000 feet or so by 00Z on March 1, accompanied by rising humidities in the lower levels.
- 1,000-500 mb atmospheric thicknesses rise with temperature, as warmer air expands.
- Convective Available Potential Energy ought to rise after 00Z on February 28, indicating that rising temperature and humidity could create convection. But Lifted Indices flat at -2 indicate the chances of thunderstorms should actually be low. Hey, it’s February in Ohio.
- Sea-level barometric pressures, better known as altimeter settings, should drop from a high of 1,032 mb (about 30.47 in Hg) to 1,015 mb (about 29.97 in Hg) right before 00Z on February 28.
- Meanwhile, low-level winds should switch from light and variable to 10 knots out of the north shortly after 00Z.
- At 2 meters/6.5 feet agl, temperatures are forecast to rise to 40 degrees Fahrenheit before 00Z on February 28, then fall below freezing by 12Z. Dew point (white dots) rises until it meets the temperature at 00Z on February 28, then the close spread continues to 12Z.
- It’s no surprise, then, that relative humidities should climb to 90 percent at the same time.
- Cloud layers are forecast to be thin and broken on the morning of February 27, become solid to the surface by the evening, then rise to become an overcast at mid-levels.
- A chance of light rain is forecast between 00Z and 12Z February 28, and again in the early morning of March 1.

Related Articles


