Weather radar
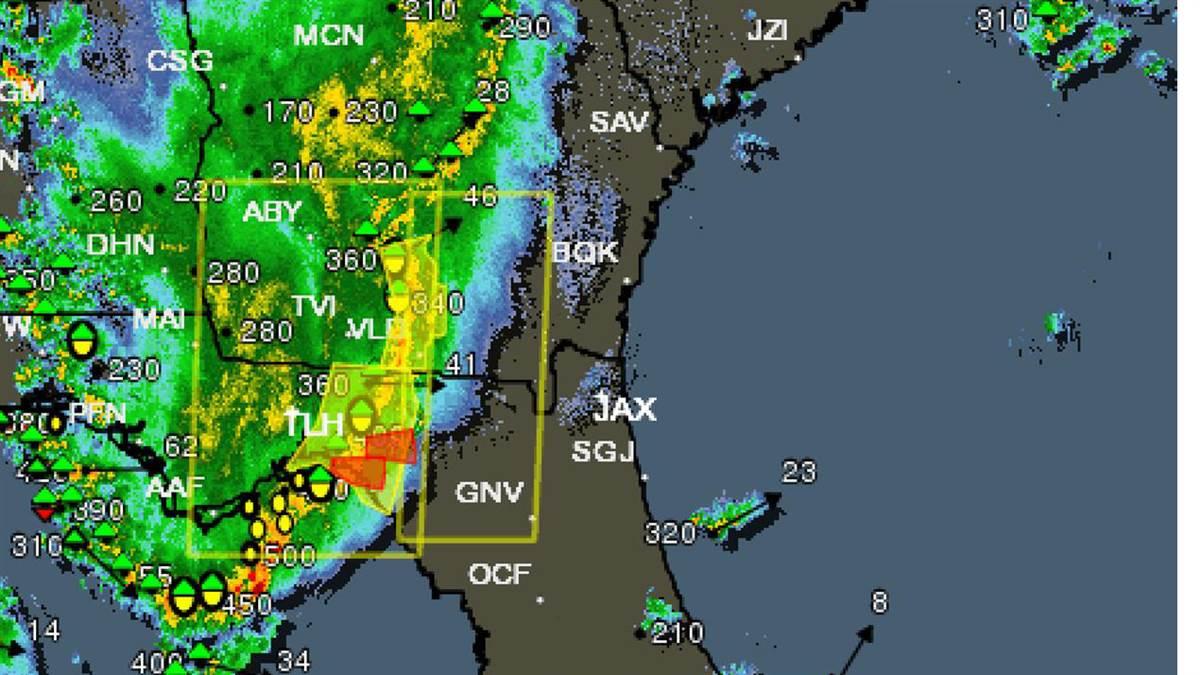
Weather radar is one of the best ways to find out what the weather is doing right now.
Green shows where relatively light to moderate rain is falling.
Yellow shows areas of heavy rain and probably turbulence.
Red shows heavy rain is falling, probably from thunderstorms, and where the worst turbulence is likely.
A basic rule for safe flying is that you need to learn what kind of weather is likely to affect your flight—before you take off. The National Weather Service and private meteorology companies produce two types of weather products to help pilots make weather decisions: reports of what the weather is doing now or in the very recent past, and what it’s predicted to do in the next few hours.
You can find maps and text for both current weather and forecasts by going online and clicking on “Weather.” In the tabs across the top, select “CONUS” (for Continental United States).
In this article we’re looking at maps of the most-recently reported, actual weather you can consult before deciding whether to go flying. Textual reports of the most recent weather data are called observations. If the observations are used to produce a map, the map is called an analysis.


Surface chart
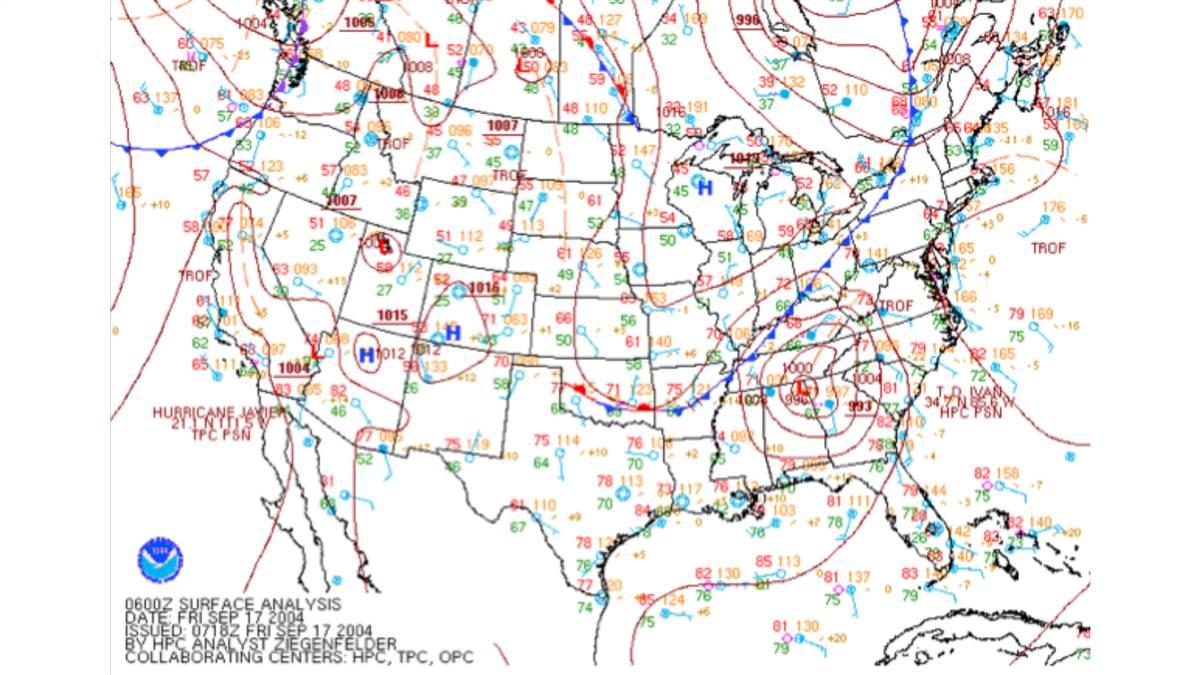
A good starting point for a weather briefing is the surface chart. It's based on the most recent reports from weather stations around the country at the time and date shown in its lower left corner.
If you saw this map when planning a flight in the Southeast, you would need to take a closer look at the weather before deciding to go.

Weather depiction chart
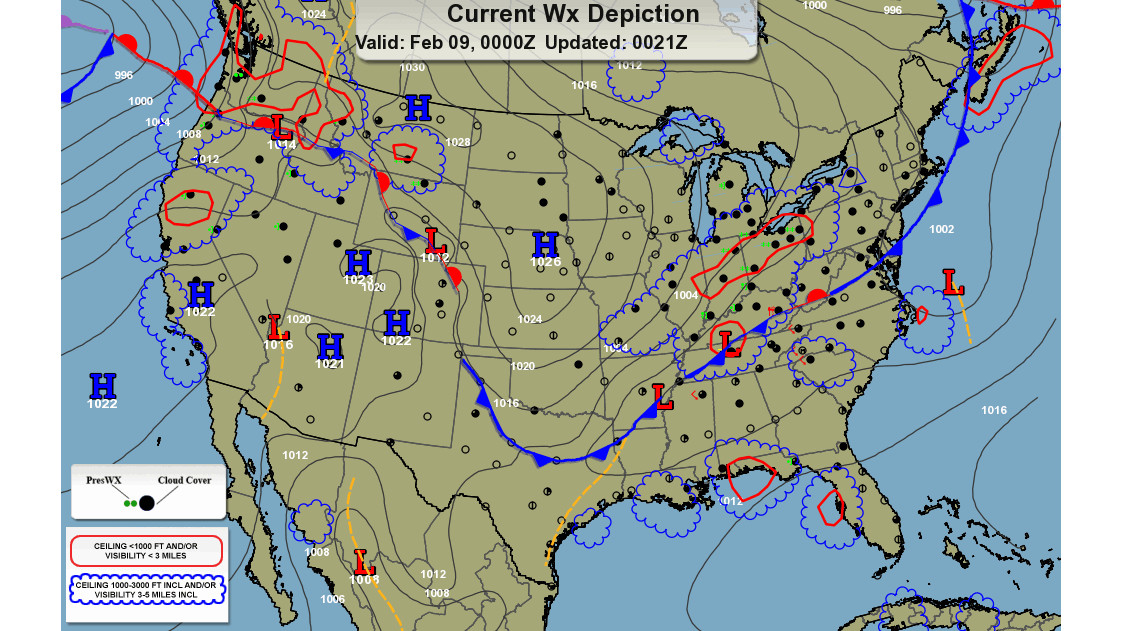
A weather depiction chart looks much like a surface chart, with fronts and centers of high and low surface pressure. However, it adds information on reported ceilings and visibilities that pilots need. It displays areas of instrument conditions and marginal VFR conditions.


