Weather Watch: Datalink Nexrad nuances
FIS-B’s radar component

That’s not necessarily so. Datalinked Nexrad has some built-in shortcomings, and many of us are not schooled in interpreting radar signatures. This can trick us into a false sense of confidence when trying to circumnavigate thunderstorm cells and complexes. It has killed unwary pilots.
Old information
One serious issue is image latency. The radar return you see on your screen—be it panel-mounted, on a portable GPS navigator, or iPad presentation—is always out of date. It takes the individual ground-based radars time to scan the sky, more time for datalink service providers to collect the returns from all those radar sites (there are 160 in the United States), and still more time to process them into mosaics. Then, they must be transmitted to you, by either satellites (XM WX) or ground stations (FIS-B). So although your display may report that a radar image is five minutes old, it may actually be many minutes older.
How much older? In June 2012, the NTSB issued Safety Alert SA-017 (amended in December 2015), which asserted that cockpit imagery could be 15 to 20 minutes older than the posted time. The safety alert included two accident summaries illustrating the dangers of image latency. In one accident, a helicopter crew saw an image posted as being one minute old. The Nexrad returns on the cockpit screen showed that severe weather was seven miles from the destination airport. In truth, at the moment it was posted on the display the image was five minutes old, and the weather was in fact crossing over the destination airport.
Five minutes may not seem like a long time. But a storm cell moving at 20 knots can cover five nautical miles in 15 minutes. If you’re flying at 120 knots you’ll cover that distance in 2.5 minutes.
One rule of thumb is to stay at least 20 nm away from the perimeter of any cumulus or cumulonimbus buildups, with the main objective being to avoid penetration at all costs. You do have a Plan B, yes? Often, a 180-degree turn is advisable, providing that buildups haven’t formed behind you. If you are flying at relatively fast air- and groundspeeds, perhaps you can safely circumnavigate using a safe standoff distance. That’s fairly easy to do if you can see the cells. If you’re on instruments, however, the job is more difficult. Now you feel compelled to rely on the datalinked Nexrad imagery more than ever—even though you may be acting on outdated information. It’s not a good feeling. Perhaps the safest option is to stay on the ground if your preflight briefing indicates widespread areas of embedded thunderstorms.
Also, it’s not unusual for aggressive cumulonimbus clouds to grow at a rate of 5,000 fpm or more. And internal storm dynamics and circulations can intensify in a matter of seconds or minutes. Think of this when you see a Nexrad display that’s “only” a few minutes old. If on instruments you may soon be in the middle of the action, if you aren’t already. If you’re visual, do you think you can outclimb those rapidly building cumuli? Not likely.
The best strategy is to avoid any building cumulus, towering cumulus, or cumulonimbus clouds by as much distance as you can. Can you circumnavigate a line or large cluster of cells? That depends on your speed, the growth of the cells, and the distance you must fly to put danger behind you. Without enough speed or fuel, your options are pretty much limited to reversing course, or landing as soon as is safely possible.
The main rule is to use Nexrad imagery to stay well away from any areas of convection. It’s tempting to use datalinked information to weave around storm cells, but don’t do it.
Composite reflectivity
Nexrad radars are able to scan the sky in different modes, and at several different antenna elevation angles. This is how meteorologists are able to identify storm structure and characteristics. If you look at Nexrad radar imagery on the internet, you’ll have a choice of viewing two common reflectivity products—base reflectivity and composite reflectivity.
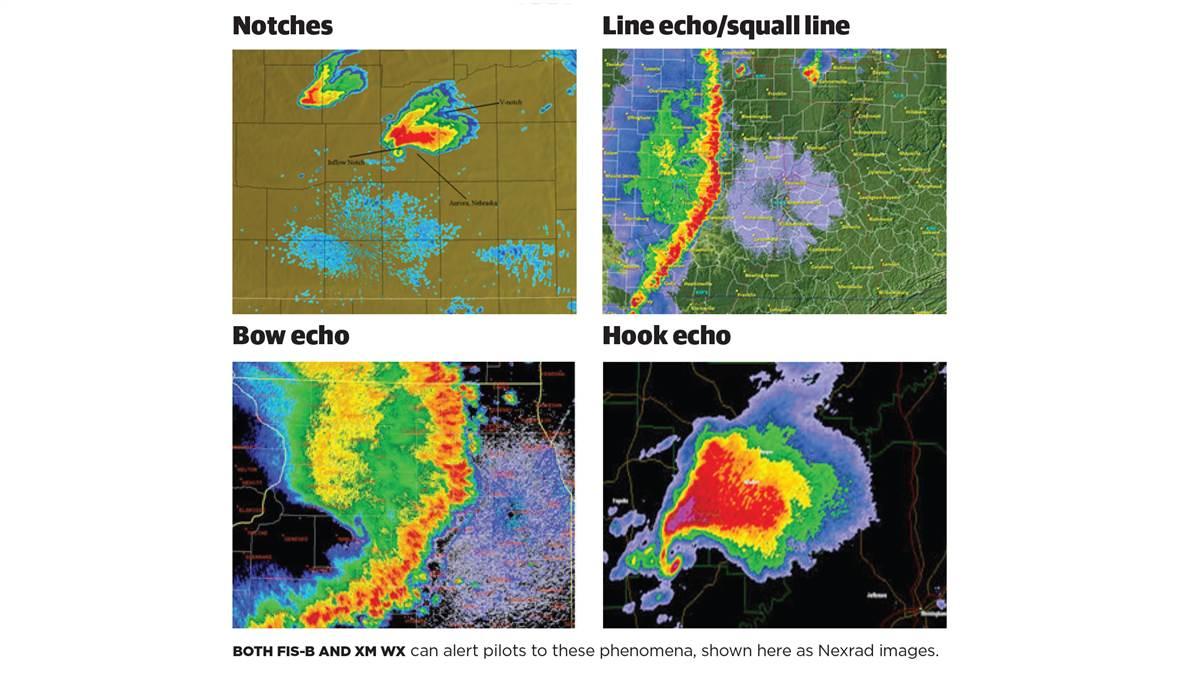
Base reflectivity is a mode that looks for precipitation at a single antenna elevation angle, usually 0.5 degrees up. That’s not a very high angle. Five miles from the radar site, this beam scans at an altitude around 5,000 feet. At its short-range limit of effectiveness, 124 miles, the beam is at 22,000 to 24,000 feet. So base reflectivity is useful for observing lower-level storm cloud signatures. These include the hook shapes a tornado makes, low-level outflow boundaries caused by gust fronts, low-level circulation patterns at the bases of storm cells, and other small-scale features.
Composite reflectivity takes in a number of scan elevation angles, and identifies the maximum echo intensity from any elevation angle at every range from the radar. Like base reflectivity, composite reflectivity has both a short-range (out to 124 nm) with better image resolution, and a long range (out to 248 nm) product with larger, blockier pixels. But the farther from the radar, the higher the elevation angles, so the composite radar scan can overshoot lower-lying precipitation. Even so, composite reflectivity gives a better picture of the total storm coverage, both vertically and horizontally. As such, it’s a better measure of the storm’s intensity.
To correct for elevation and range problems, mosaics are created. Where low antenna angles create gaps near the radar sites, and where radar site coverage patterns may not completely overlap, specialized software is used to fill in those gaps in elevation and range with data programmed to interpret and “smooth out” the radar depictions.
Here’s the bottom line: Both XM WX and FIS-B use composite reflectivity. This means that you’ll see a more complete picture of any convection, but may miss lower-level signs of trouble because they could easily be masked by radar returns from higher-elevation scans.
 FIS-B Nexrad imagery
FIS-B weather is transmitted by the nation’s network of some 650 ADS-B ground stations. These transmissions are sent in tiers—low, medium, and high—that are subject to line-of-sight restrictions. If a station happens to be located at an airport, then aircraft on its surface will be able to receive its FIS-B data. Aircraft not near a station won’t have such luck, but after takeoff, reception should kick in. That’s one limitation of FIS-B. According to the FAA’s latest interactive coverage map, most of the United States has ADS-B In coverage at and above 3,000 feet agl.
The tiers can cause other issues. They’re set up to ensure that aircraft at all altitudes can receive weather products, from at or near the surface to 24,000 feet, and beyond (usable signals can even reach as high as 40,000 feet). But line-of-sight and bandwidth considerations complicate matters.
Two types of Nexrad radar mosaics are issued by FIS-B. The continental United States (CONUS) mosaic takes in the entire nation, and has a 10-kilometer resolution, each of its pixels measuring 10 km (about 11 nm) square. It takes a lot of bandwidth to assemble and transmit the imagery covering the whole United States, so CONUS Nexrad mosaics are only made available to aircraft flying in the medium and high coverage tiers. Regional mosaics cover smaller areas, use data from nearby Nexrad radars, have 2-km (about 1 nm) resolution, and are intended for use closer to the receiving aircraft’s position. Because of its finer resolution, regional Nexrad has more definition and detail. Depending on altitude, regional Nexrad coverage can extend as far as 250 nm around an aircraft’s position.
When storms threaten, pilots naturally want to zoom in on any datalinked images to have a closer look. That’s where the resolution factor kicks in. Zoom in on a CONUS view and contours turn out blocky. Regional Nexrad gives a better rendition, but zoom in too much and you’ll still see some pretty fair-sized pixelation.
The ‘look-ahead’ factor
Your distance and altitude affect what Nexrad views you’ll be able to receive. For example, if you’re at 18,000 feet agl you should be able to see regional Nexrad imagery 250 nm ahead. At 3,000 feet agl and below, your look-ahead range should be 150 nm. But if your destination is 300 nm away, then you’ll be stuck with CONUS Nexrad and its coarse shapes.
As for METARs and TAFs, the same dynamics hold, but with an extra caveat. METARs and TAFs for airports within Class B and C airspace get preferential treatment at the 500-nm range. If you’re 400 nm from a Class B or C airport you’ll receive its METARs, TAFs, airmets, sigmets—and a CONUS Nexrad feed—but you’ll have to wait until you’re within 375 nm of a Class D airport to get its metars, TAFs, and regional Nexrad if you’re flying in the medium altitude tier.
This means that FIS-B information may be available for a distant airport, but absent from closer airports. Depending on your altitude, if weather forces you to consider landing short of your destination, the nearest airports may be metar- and TAF-free zones at lower altitude tiers.
XM versus FIS-B radar imagery
There are some big differences between XM WX and FIS-B’s Nexrad presentations. Both providers use composite reflectivity scans; however, FIS-B begins assembling its imagery only after each radar site completes a full scan of all radar antenna angles. This could be as many as 12 different scan angles, and the antenna rotations to complete them take time. As a result, the images from the scans can be five to 10 minutes old before they are made into a mosaic and beamed up to the cockpit. XM WX checks each radar site every five minutes, and begins making its images using the latest sweep of the antenna. Then it adds the scans from the previous five minutes to make what it calls a “rolling” composite mosaic every five minutes. This, SiriusXM says, means that its Nexrad images are never more than five minutes old.
XM WX also has none of FIS-B’s look-ahead issues, because its data is sent down from satellites instead of being beamed up from ground stations. This also means that XM WX Nexrad and text data can be received by aircraft on the ground.
Finally, XM WX offers better image quality than FIS-B, with 2-km resolution over the entire United States and Canada.
Then again, you get what you pay for. Subscriptions for XM WX include $34.99 per month for basic Aviator LT service, $54.99 per month for the Aviator service (which adds lightning, airmets, sigmets, freezing level, echo tops, and satellite imagery), and $99.99 per month for Aviator Pro Service (which adds convective outlooks, turbulence, current icing potential, and mesoscale discussions). FIS-B promises lightning, turbulence and icing nowcasts, and echo top products in the future.
Whether you opt for FIS-B or XM WX, let there be no doubt: The more information you have, the better. It sure beats the bad old days, when all you had was your eyeballs, a Flight Watch frequency, and some convective sigmets over certain VOR frequencies. And with FIS-B, the price is right.
Email [email protected]