FLIGHT CONDITIONS AND FLEET COMPOSITION

These unique design features make seaplane flying challenging and increase risk due to the complexities of installing floats or flying boat-shaped aircraft.
Seaplane Design
A mix of old and newly manufactured aircraft, seaplanes have three consistent design elements. The first and most noticeable is the hull-type fuselage design—constructed to sit directly on the water’s surface—commonly referred to as a flying boat. The second and third designs use pontoons attached to the underside of the fuselage—constructed to float on the water’s surface—commonly referred to as a floatplane. If the pontoons incorporate landing gear, they are called amphibious since these aircraft can operate on both land and water; pontoons that lack landing gear are called straight floats and are only capable of operating on water. These unique design features make seaplane flying challenging and increase risk due to the complexities of installing floats or flying boat-shaped aircraft.
Flight Phase
Seaplane accidents occur with the highest frequency during the landing phase of flight (34 percent), which follows overall GA accident statistics. Takeoff is second (18 percent) followed by initial climb (14 percent). These three phases of flight account for two-thirds of all accidents.
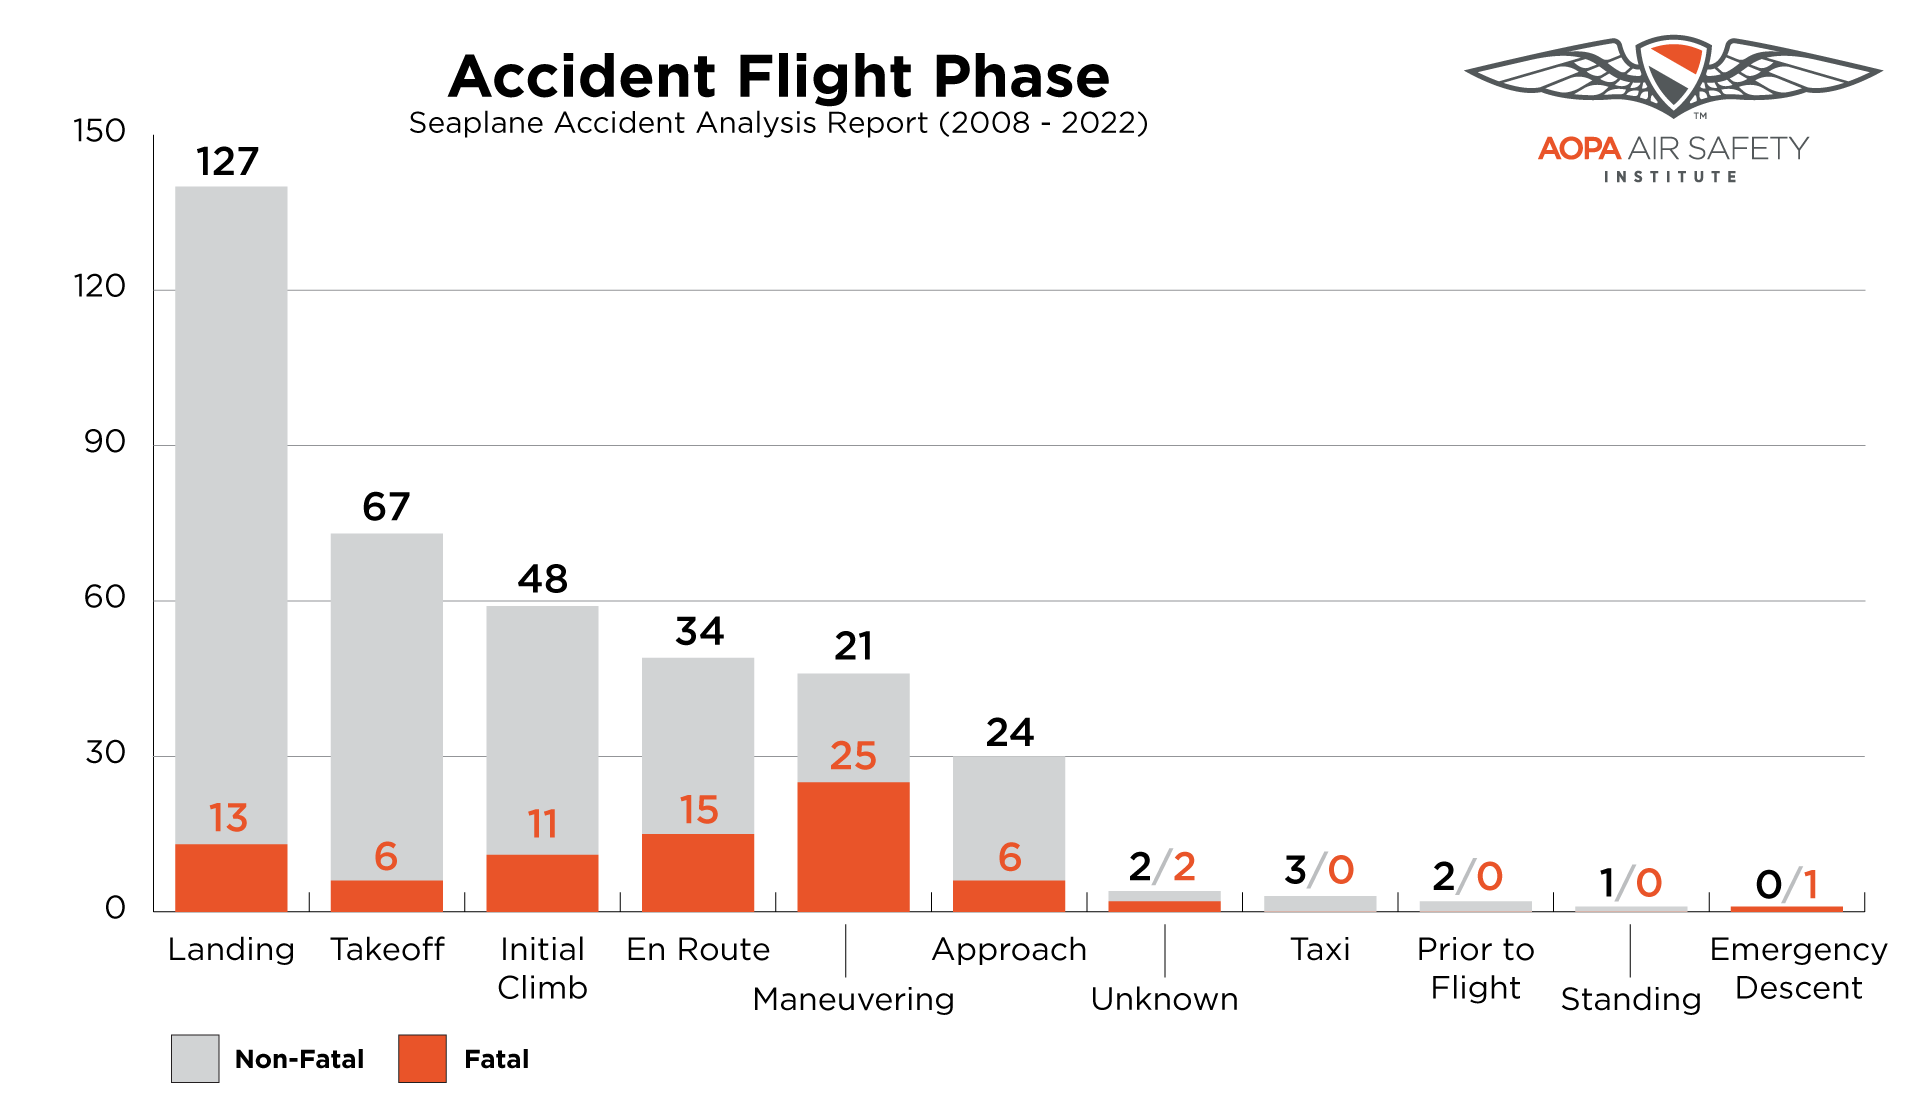
Unlike a nose-over on land, seaplane nose-overs could be survivable, but occupants may be at risk of drowning if they are unable to egress the aircraft.
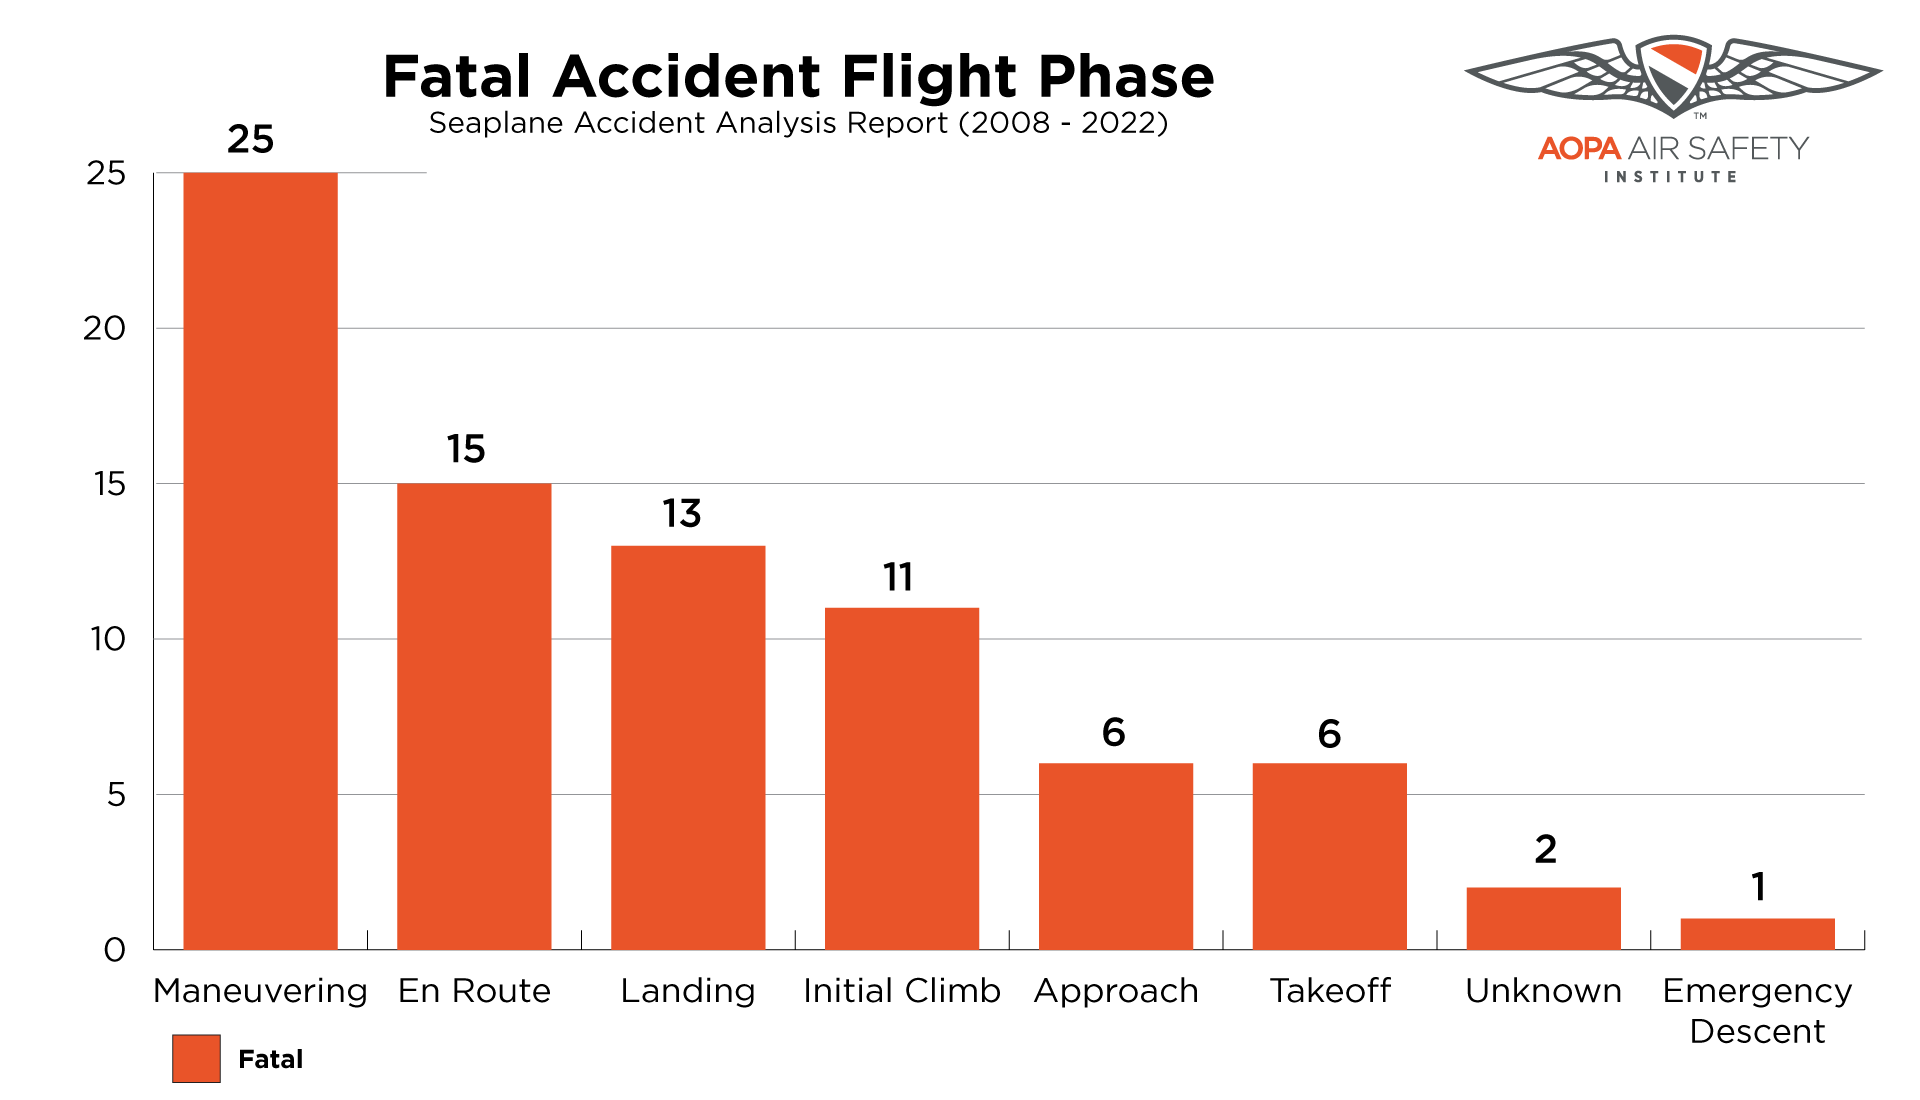
Fatal Accident Flight Phase
In contrast, extracting fatal accidents, the accident flight phase shifts. Maneuvering flight leads and accounts for 31 percent of fatal accidents. En route (19 percent) and landing (17 percent) are second and third, respectively. These three flight phases are the top two-thirds of fatal accidents. The differences between maneuvering and en route are usually altitude and destination. Cross-country flights fall into the en route phase, while flying in the local-area would put the aircraft in the maneuvering phase. Given the unique operations that seaplanes fly (e.g., sightseeing, off airport operations, etc.) it should come as little surprise that maneuvering flight has the largest concentration of fatal accidents.
Landing accidents—the third deadliest phase—traditionally carry minimal impact forces and are thus rarely fatal in non-seaplane operations. Again, the unique nature of seaplane operations contributes to accident numbers spiking within this phase. Because these aircraft operate on water and in remote areas it impacts the survivability of an accident. Unlike a nose-over on land, seaplane nose-overs could be survivable, but occupants may be at risk of drowning if they are unable to egress the aircraft. Water and the hazards associated with it add another layer of risk for seaplane pilots.
However, the difference between the numbers of Parts 91 and 135 accidents can be attributed to a higher level of required training and more restrictive operating limitations for Part 135 compared to Part 91 operations.
Type of Operation, Weather, Light Conditions, and Aircraft Fleet
Most accidents occurred in day visual meteorological conditions (VMC) operated under FAR Part 91.
Operations and Meteorological Conditions
Seaplane Report 2008-2020
| FAR Part Operations | ||||
|---|---|---|---|---|
| FAR Part | 91 | 135 | Public Use | 137 |
| Non-Fatal | 297 | 28 | 3 | 1 |
| Fatal | 63 | 14 | 0 | 0 |
| Weather Conditions | |
|---|---|
| Condition | Accidents |
| VMC | 389 |
| IMC | 15 |
| Unknown | 2 |
| Light Conditions | |
|---|---|
| Light Type | Accidents |
| Daylight | 393 |
| Dusk | 8 |
| Night | 2 |
| Dawn | 1 |
| Night/Bright | 1 |
| Night/Dark | 1 |
Type of Operation—FAR Parts 91 and 135
Unlit waterways like lakes and rivers constrain seaplane operations to daylight visual conditions. FAR Part 91 includes the largest makeup of accidents—both fatal (63) and non-fatal (297). FAR Part 135 is second with 14 fatal and 28 non-fatal accidents. Lacking activity data for seaplanes, it’s difficult to quantify the rate for each type of operation. Several high-profile Part 135 accidents have drawn media attention and NTSB review, so assessing their level of safety can be difficult. However, the difference between the numbers of Parts 91 and 135 accidents can be attributed to a higher level of required training and more restrictive operating limitations for Part 135 compared to Part 91 operations. While Part 135 operators have fewer accidents, the percentage of fatal to non-fatal accidents is 50 percent. This is likely attributed to the size, speed, and operating environment of Part 135 operators.
Type of Operation—Purpose of Flight
Aircraft operations categorized as personal flights clearly lead both fatal and non-fatal seaplane accidents. The Unknown category reflects a data limitation where accident cases have not been assigned an operation type due to an ongoing investigation or the accident reporter omitting the data. Instructional flight (i.e., flight training) follows personal flight (excluding Unknown) as the second highest operational type for seaplane accidents. The disparity between the two types is difficult to account for as personal flight leads by such a large margin. However, the most common explanation is that freedom within personal flight operations and no strict standard for operations (e.g., compared to flight training) creates an environment where pilots are the sole decision makers regarding their flights’ safety. Providing new seaplane pilots access to more experienced seaplane pilots would fill the knowledge gaps and, potentially, reduce proficiency related accidents. A mentorship program fulfills these needs and may help drive down accidents in the personal category.

Aircraft Fleet
Fleet composition plays a role in accidents, and single-engine aircraft solidly make up the highest non-fatal (313) and fatal (71) accident numbers. The aircraft make with the most accidents is Cessna (99) followed by de Havilland (56) and Piper (34). Cessna (15) tied de Havilland (15) for the most fatal accidents. It is worth noting that accident frequency is not necessarily a strong indicator of risk. In this case, the leading aircraft are not necessarily more dangerous than those with fewer accidents. This is in part due to fleet composition. If the Cessna fleet has the largest number of seaplanes in operation, then it would—most likely—have the most accidents due to the volume of operations. A true measure of risk would be rate-based, but the FAA does not publish manufacturer-specific flight hours. Again, a proportional approach could be used (i.e., the number of active aircraft). But seaplane registration data has limitations, mainly because the fleet is dynamic and seaplane owners may remove floats throughout a season converting the aircraft from landing gear to skis to floats. These changes prevent the FAA registration file from accurately capturing the true number of seaplanes in the fleet.
Top 10 Accident Aircraft Makes/Engine Types
Seaplane Report 2008-2020
| Aircraft | Non-Fatal | Fatal Accidents |
|---|---|---|
| Cessna | 84 | 15 |
| De Havilland | 41 | 15 |
| Piper | 33 | 1 |
| Lake | 9 | 1 |
| Aviat | 11 | 0 |
| Maule | 6 | 3 |
| Grumman | 4 | 3 |
| Republic | 3 | 2 |
| Progressive Aerodyne | 5 | 0 |
| Consolidated Aeronautics | 5 | 0 |
| Engines | Non-Fatal | Fatal |
|---|---|---|
| Single Engine | 313 | 71 |
| Multi-engine | 9 | 4 |
| Unknown | 7 | 2 |
Seaplane registration data has limitations, mainly because the fleet is dynamic and seaplane owners may remove floats throughout a season converting the aircraft from landing gear to skis to floats. These changes prevent the FAA registration file from accurately capturing the true number of seaplanes in the fleet.
Real Pilot Story: Underwater Escape
In this Real Pilot Story, Bryan Webster talks about his escape from an airplane nose-over accident, and he shares the knowledge he’s gained in 15 years of teaching water egress techniques.