Storm savvy
Staying aware—preflight and in flight

It’s a huge subject, but let’s go over some of what I think are “must see” items during preflight preparations. And since so many of us use datalink weather imagery, we’ll have a look at some classic storm signatures—some are easy to understand and avoid, others not so much.
Over the past 30 years or so, numerical weather prediction—predicting weather events using computer algorithms—has advanced greatly. Computer models using numerical prediction, and there are dozens of them, are accessible on the internet and one of them, the North American Mesoscale (NAM) focuses on, well, North America. Its model runs are published every six hours, and each run gives forecasts of many storm-related variables out to three days in the future. There are four big elements worth looking at. CAPE (Convective Available Potential Energy), broadly speaking, is a measure of the heat, moisture, and lift that can trigger thunderstorms; values above 1,000 joules/kilogram can cause problems, while levels above 3,000 j/kg can pretty much guarantee it. The Lifted Index (LI) is shown in another panel, and it’s a comparison of the temperature of a parcel of air lifted to 18,000 feet with the ambient temperature of the air at that altitude. If the lifted air is warmer than the surrounding air at altitude, that’s a recipe for rising motions that can kick off storms. Values of -5 (meaning five degrees warmer than the surrounding air) or less are signs that severe storms can be in the offing. Another value worth checking is surface dew point, which is a measure of the air’s moisture content. Dew points above 65 degrees? That sort of soupy air is great fuel for thunderstorms. You can find the NAM on pivotalweather.com. Click on Models, then NAM to see these and plenty of other atmospheric goings-on.
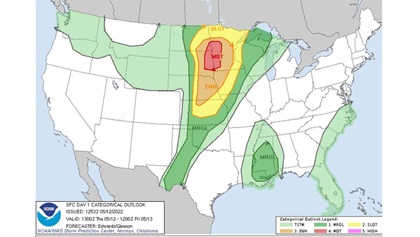
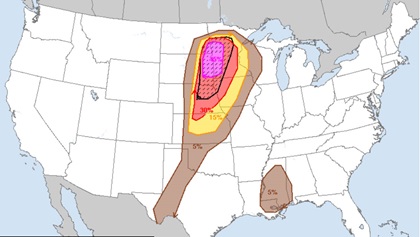
Of course, the Aviation Weather Center website—aviationweather.gov—is another must-see website for any season. Under “forecasts” it has a drop-down menu for convection. It even has a link to the Storm Prediction Center (spc.noaa.gov), another must-see website. The SPC gives today’s (“Day One”) Convective Outlook, and subsequent outlooks extending to eight days in the future. Even so, forecast accuracy degrades with time, so it’s not a good idea to bank on any predictions more than two days out. Likely areas with slight, marginal, and high chances of severe thunderstorms (those having one or more of the following: 50-knot winds, one inch or greater hail, or a tornado) are plotted with contours. But look at the top left of the outlook’s graphics. You’ll see a “categorical” button. Slide your cursor over the tornado, wind, and hail buttons to the right and you’ll see predicted probability of each of those events’ occurrence.
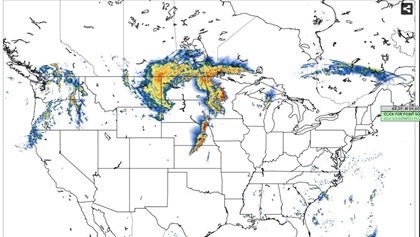
Don't use datalink radar to pick your way past individual cells, consider a 180-degree turn to completely avoid strong radar returns, and make sure you have plenty of fuel to reach more favorable weather.The last stop on our quick tour of convective models is the High Resolution Rapid Refresh (HRRR) product. It’s also on the Pivotal Weather website, has model runs every hour, and shows predictive “future radar” imagery for each of the up to next 18 hours in the model run. Select “forecast loop” under the animation button at the top of the page, click on the “severe weather” dropdown menu, and under “Explicit Convective Products” click on the “reflectivity UH>75” button. If you click on the “play” arrow, you’ll see an animation of any anticipated radar returns. It’s a great way to get a handle on what to expect—although, like any forecast, it’s not foolproof.
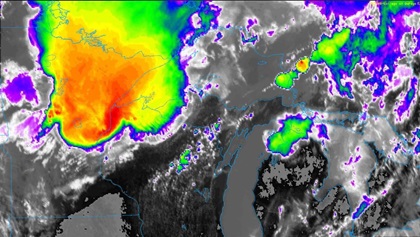
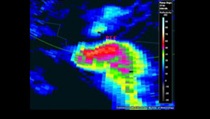
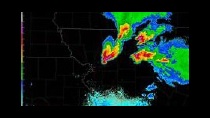
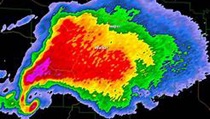
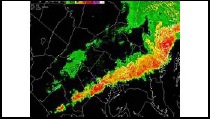
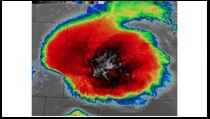
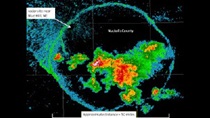
After seeing the HRRR, the next radar signatures you’re likely to see will be from your in-cockpit datalink weather radar display screen. The precipitation contours and color gradients you see tell a lot, and it’s imperative to know what a few classic signatures look like.
These are just a few examples of what you could see on stormy days. With all the information available, both preflight and in flight, it’s obvious that the standard rule should be observed: Steer well clear of any returns like these, don’t use datalink radar to pick your way past individual cells, consider a 180-degree turn to completely avoid strong radar returns, and make sure you have plenty of fuel to reach more favorable weather.
Is weather radar technology advancing as rapidly as numerical weather prediction? You bet it is. The latest Doppler weather radars have beams that don’t simply scan in one, back and forth direction. The new, dual-polarization weather radar beams scan up and down as well. This means it can discern between large rain droplets and small, between ice pellets (sleet) and snow, and much more. We’ll all benefit from dual-polarization—“Dual Pol,” for short—but that story will have to wait for another time.