Check out the new graphical area forecasts
The future is here, and your comments are welcomed

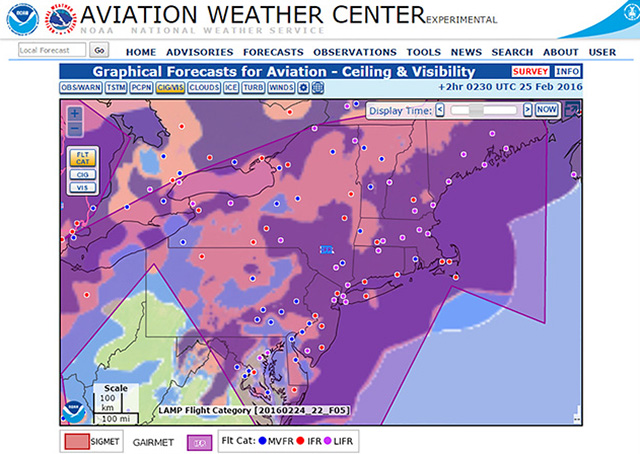
A pilot in the northeast is looking over the experimental graphical forecasts for aviation as a large area of low clouds and precipitation makes its way into the region. With the “cig/vis” button clicked, the pilot moves through time using arrows provided with the “display time” tool, or slider.
The pilot notes the northeastward movement of the weather system that is forecast to occur during the period. The mass of weather includes a well-defined area where an airmet is in effect for “CIG BLW 010/VIS BLW 3SM PCPN/BR.”
Clicking next on a button that brings up a graphical presentation of clouds, and selecting the desired time for the display, the pilot’s computer screen is filled with a multi-colored rendering of expected cloud cover, accompanied by localized sky conditions to expect, consisting of cloud coverage, bases, and tops.
What about icing? There’s a graphics page for that too—and as you click through the forecast time period, the area of the icing airmet (which gives the freezing layer or layers, type, and severity of icing) moves and reconfigures with the passage of time.
Those are just three of eight pages of graphics you can inspect right now if you care to examine the futuristic weather products that will soon replace the text-heavy area forecast.
Taking the time to do so will be well worth the effort, and will give you an opportunity to click a survey button and offer your suggestions about the design of the new product. Area forecasts, which originated in the 1930s, will probably be discontinued later this year for the lower 48 states. They will continue to be available, for the time being, for Alaska, Hawaii, the Caribbean, and the Gulf of Mexico coverage areas.
AOPA and the Air Safety Institute have been studying and commenting on the experimental product since the National Weather Service’s Aviation Weather Center made it available for public inspection—and many of the association’s suggestions have been incorporated in the still-evolving design, said Rune Duke, AOPA director of airspace and air traffic.
“AOPA remains committed to providing meaningful feedback to ensure this tool will meet the needs of users while improving the presentation and utility through greater functionality,” he said, encouraging pilots to look over the new offerings, provide comments, and share them with AOPA.
Comments will be accepted on the experimental graphical forecasts for aviation until April 11. The new product and its components “are designed to provide meteorological information equivalent to the textual Area Forecast (FA) in a graphical format, as requested by the FAA. This product includes observations and forecasts valid for the continental United States that provide data critical for aviation safety, overlaid on high-resolution basemaps. Please note that the text-based Area Forecast is still being produced,” says a note on the Aviation Weather Center’s website.
Suggestions made by AOPA that have been adopted for the new products, or are in the works, include such refinements as providing a means to filter out certain airports from the display to reduce clutter, and making sure pilots know when a particular type of information is not available for technical reasons.
AOPA also has suggested adding a time stamp to the weather briefing. In addition, providing a tool that guides a pilot through the menu selections to ensure that a graphical briefing provides all the same information as the textual area forecast does now would sharpen the product’s utility, Duke said.


