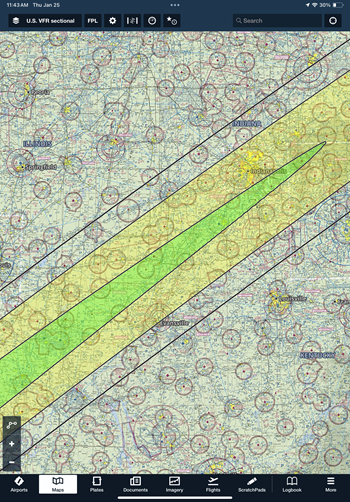
Airports in the path of totality
Airports in the path of totality
Utilizing ForeFlight, AOPA has created a content pack that lets you plot the path of totality, allowing users to determine airports along the path. The eclipse path lines, and totality times come from official data provided by NASA.
Download to ForeFlight (iPad/iPhone only)
How to install the 2024 Eclipse App in ForeFlight:
- Using the mobile device where Foreflight is installed, tap the Download button above, or use this link “Download ForeFlight Content Pack.” This will launch the ForeFlight EFB app and add the AOPA 2024 Eclipse content pack to your downloads. Note: You may need to select the "Open" button in the ForeFlight banner at the top of your screen if ForeFlight does not automatically open.
- If you have automatic downloads enabled in ForeFlight, the content pack should begin downloading in a few moments. If you do not have automatic downloads enabled, then you will need to go to the Downloads screen in ForeFlight and tap the blue download icon next to the AOPA 2024 Eclipse content pack.
- If you do not see the 2024 Eclipse Download in ForeFlight as noted above, tap on More at the bottom right of the page, then tap Custom Content. Under Content Packs, tap on AOPA Eclipse 2024 and tap Install from the dialogue box. The pack should then be available in the Layers menu.
- To view the new content pack layer after downloading, go to the Maps screen in ForeFlight and select the layers menu in the upper left corner. You should see the AOPA Eclipse 2024 layer available at the bottom of the right-hand column.
- More info on ForeFlight App can be found here.

About the content pack

The shaded areas indicate the amount of totality time and are as follows:
- Center shaded area (green when viewed on a sectional chart): 4-plus minutes of totality.
- Outer shaded area (yellow when viewed on a sectional chart): 3 to 4 minutes of totality.
Note: The colors of the shaded areas may vary a little depending on which base layer in ForeFlight is enabled. For the purpose of this explanation, they will be defined as green and yellow since that is how they appear on a sectional chart base layer. However, the colors have transparency so if a different base layer is enabled, the colors may vary from how they appear on a sectional base layer.
- The closer to the center of each shaded area, the more totality time will be experienced.
- The outside lines around the unshaded area depict the full eclipse path and will have some totality time but will be less than 3 minutes and continue to reduce to 0 at the perimeter line.
- The path and shaded areas do not indicate the times when the eclipse will be in certain areas or over airports so the times will need to be obtained elsewhere.