WX Watch: Convection, by the numbers
How warm air rises

 That warm air won’t have enough energy to rise unless the air surrounding it is cooler. In a standard world, where air cools at a lapse rate of two degrees Celsius (3.5 degrees Fahrenheit) per thousand feet, air temperatures gradually and predictably cool with altitude. That’s fine for a theoretical construct, but nature is seldom this constant or predictable. A stagnant air mass may have a temperature profile that’s quite similar from top to bottom. That would be a stable air mass.
But what if temperatures are colder than standard the higher you go? And what if temperatures near the surface are way warmer than the standard-issue 15 degrees Celsius (59 degrees Fahrenheit)? That’s a very unstable air mass—the kind you’d see on a hot summer day as a front passes through. The greater the difference between the warm and cold slices of the atmosphere, the faster the warmer air will rise through the colder air. Textbooks speak in terms of rising parcels of air, showing them as balloons, but in the real world the warm “balloons” are large enough to cover several counties—or states.
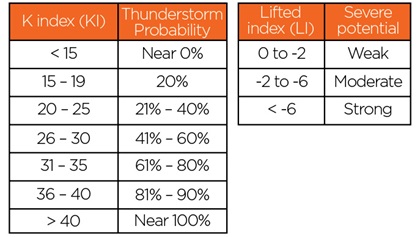
 There are several ways to define and quantify the instability of an air mass. One is the lifted index (LI). This uses a formula that takes a parcel of air near the surface, lifts it to about 18,000 feet (500 millibars, in terms of a constant pressure level), and compares its temperature with that of the surrounding air—or the actual environmental temperature. Subtract the parcel temperature from the environmental temperature and you get your index. A temperature difference of zero to 2 degrees indicates weak instability; a 10-degree difference is classified as extreme instability. That’s when convective updraft forces would be the highest. You can call up lifted indices at twisterdata.com under the instability link, or at other websites.
The K index (KI) is another traditional means of describing the potential for instability. It’s a combination of lapse rate, moisture levels at about 5,000 feet (the 850-millibar constant pressure level), and the humidity at about 10,000 feet (or the 700-millibar constant pressure level). Below a KI of 15, expect no thunderstorms, but there’s a 100-percent chance with a KI of 40 or more.
 There are plenty more expressions of instability: the Showalter Stability Index, the Total Totals Index, the Bulk Richardson Number (BRN), Storm Relative Helicity (SRH), the Energy-Helicity Index (EHI), the Deep Convective Index, and much more. Those helicity indices are measures of tornado potential.
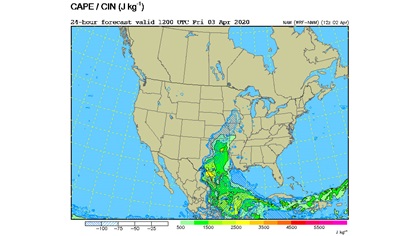
Convective Available Potential Energy (CAPE) has become today’s go-to benchmark for evaluating instability. CAPE shows an air parcel’s buoyancy force as it rises through the atmosphere. This force is expressed in a complex thermodynamic equation that uses joules per kilogram (J/kg) as its measure of energy per unit of mass. In this case, that mass is an air parcel. The cooler the surrounding air (again, compared to the temperature of the rising air parcel) the stronger the CAPE, and the stronger the potential thunderstorm intensity. You can see CAPE at the Storm Prediction Center website (spc.noaa.gov/exper/sref, choose Surface under the Instability drop-down menu). The higher the CAPE, the greater the risk of severe storms. A rating of less than 1,000 J/kg doesn’t indicate much trouble; above 2,500 J/kg, look out. Hail and frequent lightning could be afoot.
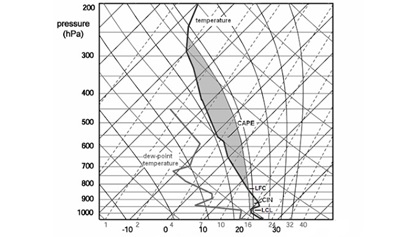
Convective Available Potential Energy (CAPE) has become today’s go-to benchmark for evaluating instability.I know that Skew-T Log P charts inspire dread and loathing among many, but they happen to be one of the best sources for visualizing CAPE. On a Skew-T, CAPE shows up as a margin between the lines plotting actual temperatures aloft and the temperatures of rising air parcels. The bigger the gap between the two, the greater the CAPE. Some Skew-T charts even post the calculations, so you don’t need to do any measurements or math grunt work. I’ve included a few with the article.
Of course, Flight Service and other weather briefing sources of information can fill you in on the odds of convection apt to affect your flights. But if you’re like me, you’re more curious, and want to delve a little deeper into the whys and hows of thunderstorm origins. It’s all about vertical temperature profiles, and we’ve just had a glimpse at some of the ways they’re presented.
Email [email protected]
 Partner provided content
Identify, avoid convection with satellite weather
Satellite weather provides valuable insight onboard your aircraft during thunderstorm season.
Base reflectivity radar updates every five minutes and shows what is coming out of the bottom of a storm cell, which is beneficial to pilots flying below 10,000 feet.
Cloud-to-cloud and cloud-to-ground lightning data is updated every 2.5 minutes. Cloud-to-cloud lightning provides an early indication of a developing storm.
Storm tracks and echo tops allow you to monitor the speed, direction, and height of a storm, helping you maneuver around dangerous weather at a safe distance.
aopa.org/siriusxm

Thomas A. Horne
Related Articles